The Formation of Advancing Pockmarks Arrays: An Interplay between Hydrocarbon Leakage and Slope Sedimentation*
Sutieng Ho 1 , J. A. C.1, and Patrice Imbert2
Search and Discovery Article #50592 (2012)
Posted April 16, 2012
*Adapted from extended abstract prepared for poster presentation at AAPG Annual Convention and Exhibition, Long Beach California, April 22-25, 2012, AAPG©2012
1 (Previously) 3D Lab, Cardiff University, Cardiff, United Kingdom, [email protected]
2 Total CSTJF, Pau, France
Abstract
Advancing pockmarks composed of multiphase, migrated infill-sets are observed above gas-bearing channels and deep-seated extensional
faults in a high-resolution 3D seismic survey of the Lower Congo Basin, offshore Angola. They occur within a Neogene-Quaternary-aged
sedimentary sequence deformed by polygonal faults. “Advancing” pockmarks are so termed based on the presence of migrating stratal
packages which represent episodes of infill; i.e., where apices are laterally offset by hundred(s) of meters. Migration occurs systematically in
the same direction over the evolution of the pockmark array. “Normal” vertical-stacked-up pockmarks on the contrary show vertically
stacked successive episodes of individual pockmark formation.
The objective of this research is to establish what factors control the development of advancing pockmark arrays and what implications they
have for leakage of hydrocarbons. Advancing and “normal” pockmarks occur in different settings. “Normal” pockmarks develop on
horizontal slopes whilst “advancing” pockmarks are located on inclined slopes or in channels. Migration occurs in the downslope direction,
implying that bottom currents play a role in the migration process. These pockmarks developed above a turbidite channel which is overlain
by a gas hydrate highlighted in seismic data by a bottom-simulating reflector (BSR). The BSR is restricted to channel areas. High seismic
amplitudes within the pockmarks below the BSR suggest that they are filled with free gas.
The following emplacement mechanism is interpreted for advancing pockmarks arrays:
1) Initial slope topography of the system is created by expulsions of gas focused through the underlying turbidite channel;
2) Fine-grained sands are draped over the pre-existing pockmark crater;
3) The vortex resulted from a higher influx rate of bottom currents, in combination with seepages, resuspended the unconsolidated sediments
on the downstream pockmark sidewall. A local starving area was thus created. This area is covered directly by another fine-grained layer
which in turn is deformed in the downstream side. The same process is repeated, starving areas are stacked up and vertically connected to
each other. A permeable pathway for fluid flow is developed along the downstream pockmark sidewall.
4) Fluid leakage through the permeable pathway determines the location of future pockmarks which are preferentially developed on the
downslope flank. The result is a downslope migrating pockmark fill.
In conclusion the two main factors that control the formation of advancing pockmarks are:
1) fluid flux,
2) the interaction of local bottom currents with sedimentation and pre-existing pockmark topography.
Introduction
Pockmarks which migrate laterally during development is a phenomena which is rarely observed. More commonly pockmarks are static
where the apex of the infill sequence is stacked vertically. To differentiate between these two kinds of pockmarks we refer to pockmarks
with laterally migrating infill geometries as “advancing pockmarks” whilst pockmarks with static infill are referred to as “normal”
pockmarks. In this article we use 3D seismic data from a basin Offshore Angola to describe this new type of advancing pockmarks.
Pockmarks lined above buried channels (Figure 1) or faults have previously been described by Davies, (2003); Gay et al. (2006); Pilcher et
al. (2007), but none of their reported features show obvious multi-phased internal structures. Heinio and Davies (2007) described
depressions of a different origin which contain laterally migrating infill sequences that are aligned to form an advancing trail. They proposed
that the migrating infill sequence originated through the action of bottom-water currents (Heinio and Davies, 2007). However, advancing
pockmarks that are observed here are associated with several types of fluid-venting indicators. Their multi-phased internal structures and
specific locations on the slope highlight the interaction between fluid flow and bottom-current activities. These aforementioned features are
well imaged and interpreted in a high resolution 3D seismic survey. The survey has a vertical resolution of c. 8 ms (3 – 4 m) with a bin size
6.25 x 6.25 m, yielding a horizontal resolution of 6.25 m. These characteristics allow a detailed analysis of the internal “fill” geometry of
pockmarks in the study area. We reconstruct the evolution of the palaeo-seabed within the pockmark through analyzing the morphology and
deformation of the pockmark-fill sequence.
Results
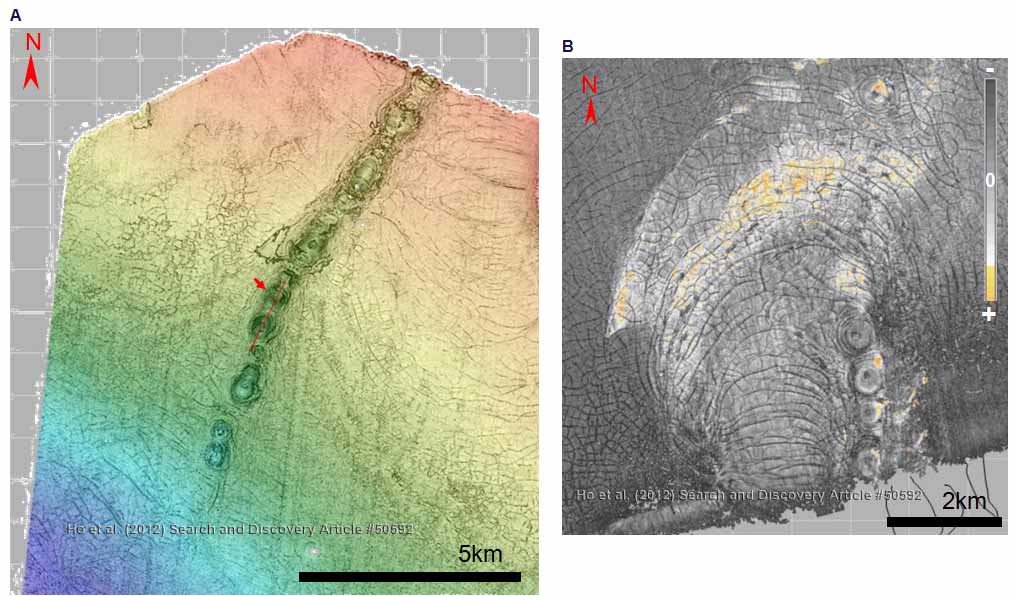
Pockmarks within the study area can be observed on Figure 1a. The base map shows that advancing pockmarks are located above deep-
seated extensional faults and channels (Figure 2). They are aligned parallel to the strike and axis to form a trail. While “normal” stacked-up
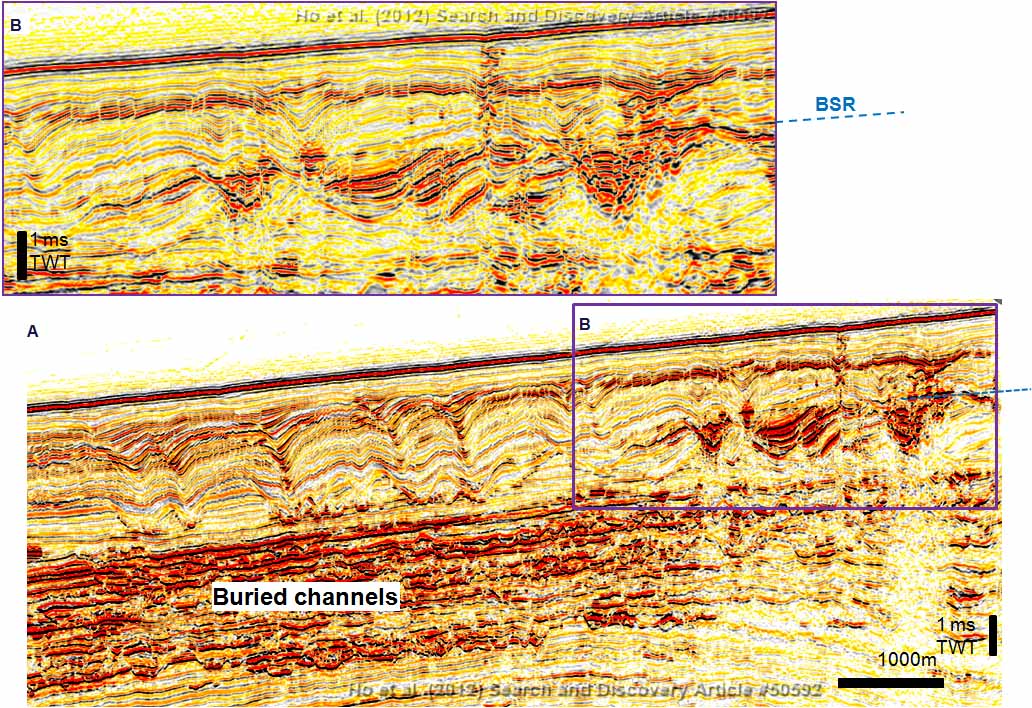
pockmarks can be seen on only on flat-lying areas, e.g., the hanging wall limb on Figure 3b. All of the pockmarks observed in the survey are
surrounded by concentrically aligned polygonal faults (Cartwright, 2011, Imbert et al., submitted). Interestingly polygonal faults are not
present within the infill sequence of the pockmark.
Following detailed horizon mapping within advancing pockmark arrays, we observed two main features within the pockmark. These refer to:
1) the lateral shift in the position of the apex of the infill sequence and 2) the physical migration of the pock mark crater.
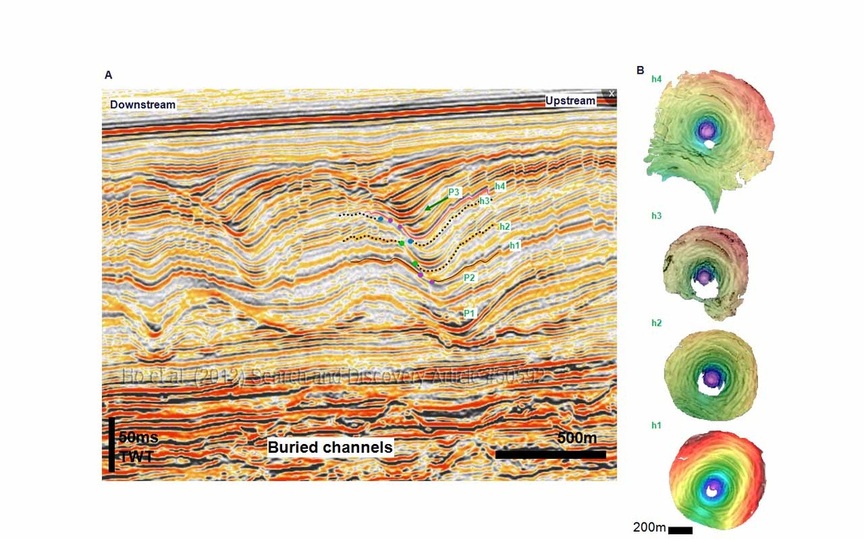
1) Lateral migration of infill sequence: The seismic section transecting the axis of the channel on figure 1a shows a stacked infill sequence of
the pockmark advancing in the downslope direction (e.g. Figure 1a, h1 – 3). Seismic reflections within the pockmark are discontinuous on
the downstream side. The discontinuity is expressed in plan view as horseshoe shape (Figure 1b, h1-3).
The green points on the section on Figure 1a represent the point at which the horizon h2 ceases continuity and terminates at the downstream
sidewall of the pockmark. One of them onlaps against the downstream sidewall of the pockmark, whilst the other is located outside of the
pockmark. The later is truncated by younger reflections.
The lateral migration of the inclined onlap terminations against the downstream sidewall of the pockmark form what appears to be a
migrating or advancing pockmark. However, this is simply the influence of regional slope and locally depressed bathymetry (pockmark
crater) on sediment deposition within the pockmark. Interestingly the portions of pockmarks sidewall that did coincide the central axis of paleo
channel, apart from the downstream portions, are continuous and parallel strata geometries within the pockmark.
2) Lateral migration of pockmark craters: Secondary pockmarks (e.g., p3 in Figure 1a) were observed to appear intermittently on and above
the downslope side of pre-existing pockmarks (Figure 1b, h4). The infill sequences at the base of the pockmark on the downstream flanks
are often truncated by overlying infill layers. This indicates that the centre of the new pockmark depression has translated laterally, causing
erosion of the downslope flank of the preceding infill sequence (Figure 1b, h4; also see arrays in right and left side in Figure 1a).

Figure 2. Distribution of advancing pockmarks in the study survey. (A) A isochron map that crosses the base of an advancing pockmark trail,
which occurs above buried channels. Red line indicates the location of seismic section in Figure 1. (B) An amplitude map shows advancing
pockmarks lined above a local extensional fault set.
Associated fluid venting features
BSR’s are observed within the lower portion of the pockmark trail and are associated with seismic-acoustic pipes, which are located along
the buried channel in Figure 3.
Local-scale polarity inversions were observed on the burial channel surface. Negative high amplitude reflections occurred locally right above
the previous location, and were found at the base of the interval containing polygonal faults and pockmarks.
Hypothesis
In the following section we outline our model for the development of advancing pockmarks. This is based on: 1) the nucleation site and
migration of pockmark craters, 2) the stratal geometries within the pockmark crater, and 3) their association with gas hydrates.
1) Initial depression: Fluid was expelled from the underlying channel creating, the earliest pockmark (p1 in Figure 1). Future eruptions
occurred on the seal of this pockmark and created another depression (p2 in Figure 1). The second formed which provided the nucleation
point for advancing pockmark development.
2) Cycle of sedimentation and deformation : Once a depression was created, the first phase of infill occurred. The infill phase may occur
during times of reduced bottom-water current activity. The discontinuity of the reflections within the pockmark (Figure 1a, h1-3) could
occur either through erosion or reduced sediment deposition. These resulted from the attenuation of seismic reflections because of thin beds
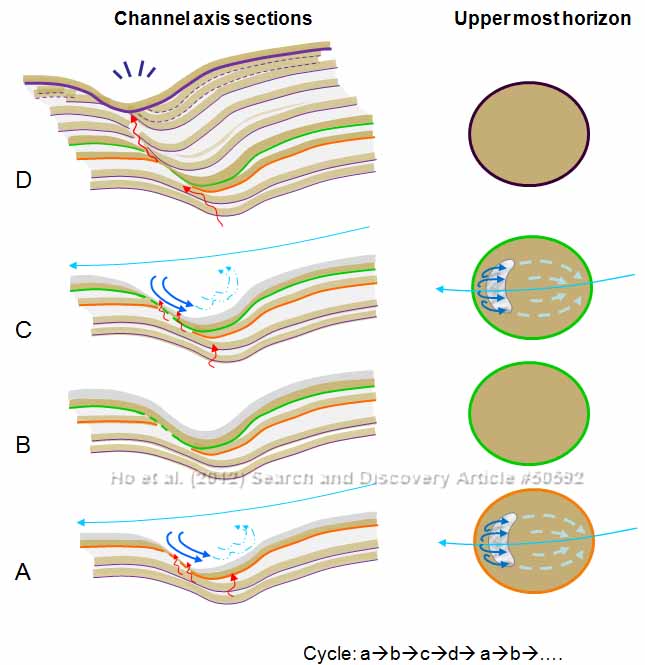
below the vertical resolution. Vortex is most likely the origin of erosion (Figure 4). It was generated close to the downstream pockmark
sidewall by the acceleration of bottom current when water flowed into the pockmark from the upstream of paleo-channel (Abelson and
Denny, 1997; Manley et al., 2004). Unconsolidated fine-grained sediments on the downstream sidewall were thus re-suspended by the vortex
(Abelson and Denny, 1997; Manley et al., 2004). Reduced sediment deposition by episodic venting on the sidewall is probably an additional
cause (De Vries et al., 2007). Lithostatic pressure was reduced within sediments at the downstream sidewall of the pockmark due to erosion
caused by the activity of bottom-water currents, thus promoting fluid escape.

Figure 4. Model for the development of advancing pockmarks. (A) Fine-grained sand on the downstream pockmarks sidewall re-suspended
by vortex and seepage. A horseshoe-shaped truncated area was formed. (B) The infill phase may occur during times of reduced bottom-water
current activity. Thus horseshoe-shaped void was filled by the new deposits. (C) Stage A repeated after a new layer deposited. (D) Lateral
migration by the creation of secondary pockmarks, which truncated the downslope flank of the preceding infill sequence.
3) Advancing visual effect and permeable path: Later phases of sedimentation resulted in a draping of the initial depression (Figure 4b).
Throughout the lateral advancement of the pockmark, sediments infilled the horseshoe-shaped void left by sediment starving. During phases
of seepage and increased bottom current activity these draped sequences were periodically eroded (Figure 4c). These two processes form the
infill geometries observed in Figure 1a (h1 – h3). Fluid flow pathways were created along the downstream pockmark sidewall through the
vertical connection of permeable, fine-grained sand layers at different horizons (Figure 4c).
4) Secondary crater formation: Focusing of bottom water currents during times of lower sea level preferentially erodes the downstream
side of the pockmark fill. This acts to reduce the lithostatic pressure, creating conditions for overpressure and thus controlling the site where
a new eruption crater is formed (Figure 4d). Repetition of preferential erosion, overpressure, and crater formation toward the downslope
direction results in a lateral migration of the pockmark (Figure 4d). The top of the migration patch is interpreted as the bathymetry of the
paleo-seabed, and localized at the downstream flank of the uppermost depression.
5) Sealing phase : The lateral migration of the pockmark terminates when fluid venting ceases. Once fluid venting stops, new depressions
cease to form and are buried by subsequent sedimentation.
Conclusion
Advancing pockmark arrays record the paleo-activity of fluid movements, which in this study is envisaged as a combination of bottom currents and subsurface seepage at the paleo-seabed.
Buried channels or deep faults provide conduits for fluid flow. Degassing most likely occurred along the axis of the buried channel during
times of lower sea level.
The lateral advancement of pockmarks results from the interplay between fluid venting and generation of local depressions in the sediment
surface, and the perturbation of bottom-water currents within the depression.
For the advancing pockmark location, fluid flow variations control the creation of pre-existing topography, which in turn controls the
location of sedimentary accumulation.
Bottom-current dynamics and seepage within pockmarks or topographic depressions modify the deposition of sediment grains. They have
direct impact on the vertical communication of different layers as the varying degree of grain size is likely to control permeability.
Acknowledgement
We are grateful to Total S.A. for technical support and for providing us with data set. SH acknowledges support from Cardiff University
research grant and Total S.A.’s financial support. Thanks to Dan Carruthers for all useful discussion and his guidance.
References
Abelson, A., and M. Denny, 1997, Settlement of marine organisms in flow: Annual Review of Ecology and Systematics. v. 28, p. 317-339.
Cartwright, J., 2011, Diagenetically induced shear failure of fine-grained sediments and the development of polygonal fault systems: Marine and Petroleum Geology, v. 28, p. 1593-1610.
Davies, R.J., 2003, Kilometer-scale fluidization structures formed during early burial of a deep-water slope channel on the Niger Delta: Geology, v. 31, p. 949-952.
De Vries, M. H., G. Svanø, T.I. Tjelta, A.J. Emdal, 2007, Pockmarks: created by reduced sedimentation or a sudden blow-out?, in Proceedings of the 17th. International Offshore and Polar Engineering Conference.
Gay, A., M. Lopez, P. Cochonat, N. Sultan, E. Cauquil, and F. Brigaud, 2003, Sinuous pockmark belt as indicator of a shallow buried
turbiditic channel on the lower slope of the Congo basin, West African margin: Geological Society, London, Special Publications, v. 216, p. 173-189.
Imbert, P., A. Gay, S. Ho, and S. Nahan, 2011, Polygonal fault networks in conjugate pairs and pockmarks in fine-grained series: timing of initiation and mutual relationships. Submitted to Marine Geology.
Pilcher, R., and J. Argent, 2004, Mega-pockmarks and linear pockmark trains on the West African continental margin: Marine Geology, v. 244, p. 15-32.
Key words: Sutieng Ho pockmark Sutieng Ho gas chimney seismic Sutieng Ho polygonal fault Sutieng Ho methane authigenic carbonate Sutieng Ho Lower Congo Basin Angola

Fluid-Venting-System website by S. HO is licensed under a Creative Commons Attribution-NonCommercial-NoDerivatives 4.0 International License.


