


Spatial variations in geometries of polygonal faults due to stress perturbations & interplay with fluid venting features
Poster presentation in 75th EAGE SPE EUROPEC 2013 by
Sutieng Ho *2, Dan Carruthers *2, Patrice Imbert 1, Joe Cartwright2
1Total, CSTJF, avenue Larribau, 64018, Pau
2 (Previously) Cardiff University, School of Earth and Ocean Sciences, Main Building, Park Place, Cardiff, UK, Wales, CF10 3YE
*Email contact: [email protected]; [email protected]
Key words: Sutieng Ho pockmark Sutieng Ho gas chimney seismic Sutieng Ho polygonal fault Sutieng Ho methane authigenic carbonate Sutieng Ho Lower Congo Basin Angola
Abstract
Joint and fracture networks provide pathways for fluid flow and predicting spatial variations in their length, spacing and orientations is vital in reservoir modeling (Rawnsley and Wei, 2001). In the absence of cores from densely spaced wellbores, reservoir geologists rely on constraints of the in-situ or palaeo-stress field and analogous outcrop exposures to extrapolate fracture models to the 10-1000's m scale (Bourne et al. 2000; Rawnsley and Wei, 2001). To overcome the limitations imposed by the scale of outcrop exposures and discontinuity of data samples between adjacent wells we present a case study of laterally extensive (>100 km2) arrays of small intra-formational normal faults in a Neogene-Quaternary succession of hemipelagites offshore Angola. These small, densely-spaced normal faults formally known as Polygonal Faults (PFs) cut seismic horizons with throws of 10-15 m and define vast polygonal fault networks (Fig 1). The spacing and length of the faults are crudely related to tier thickness and because they are confined to very fine-grained sediments they are potentially, scalable analogues to sub-seismic fracture networks in units containing shale gas.
In this study we;
1) demonstrate the spatial complexity of the plan form geometry of polygonal fault systems (PFS) and classify patterns into 5 types namely; Isotropic-polygonal, ladder patterns, concentric patterns, radial patterns, and complex combinations of the above.
2) demonstrate how changes in fault patterns can be used to reconstruct relative orientations of the horizontal stresses at the time of faulting and infer relative magnitudes of stress anisotropy associated with salt structures, withdrawal basins and gently dipping stratigraphy.
3) demonstrate the spatial and geometric relationship between fluid venting structures and polygonal fault systems.
Our work highlights the importance of;
The influence of stress anisotropy on the geometry of small, intra-formational fault systems in shales and claystones
The role of extensional faulting and the near fault stress field on the fluid migration.
I. Polygonal fault patterns
1.1. Polygonal fault systems in the Lower Congo Basin
The study area is located in the Neogene-to Quaternary stratigraphy of the salt-bearing passive margin of Western Africa in the Lower Congo Basin.
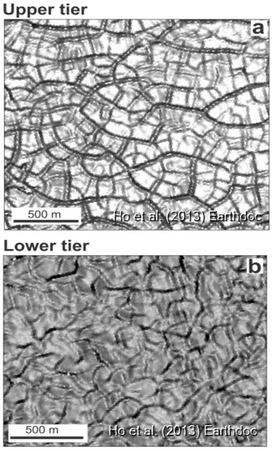
Two layer-bound arrays (tiers) of PFs are identified in the Neogene-to-Quaternary section of the study area (Fig.1.1a-c).
The intervals deformed by polygonal faults are deformed by salt structures and associated crestal and keystone faults due to gravity gliding of the overburden over detachment surface composed of Aptian evaporites.
Tier stratigraphy is intersected or disrupted by fluid venting structures such as chimneys, pipes and pockmarks.
Tier stratigraphy thickens into salt withdrawal basins and pockmark craters and thins onto the flanks of salt diapirs.
Structural properties of PFs
The study area is located in the Neogene-to Quaternary stratigraphy of the salt-bearing passive margin of Western Africa in the Lower Congo Basin.
Two layer-bound arrays (tiers) of PFs are identified in the Neogene-to-Quaternary section of the study area (Fig.1.1a-c).
- The deepest tier (Tier 1) ranges from 70-130 m thick and is composed of Late Miocene claystones.
- The shallowest tier (Tier 2) contains Pliocene fine-grained turbidites and has a maximum thickness of 250 m but thins laterally until the tier pinches out (Fig 1c).
The intervals deformed by polygonal faults are deformed by salt structures and associated crestal and keystone faults due to gravity gliding of the overburden over detachment surface composed of Aptian evaporites.
Tier stratigraphy is intersected or disrupted by fluid venting structures such as chimneys, pipes and pockmarks.
Tier stratigraphy thickens into salt withdrawal basins and pockmark craters and thins onto the flanks of salt diapirs.
Structural properties of PFs
- The strike length and spacing between individual PF segments in map view are crudely related to tier thickness.
- PF segments in Tier 1 range from 100-180 m in length and have an average spacing of 150-200 m.
- PF segments in Tier 2 are 150-250 m in length and have an average spacing of 100-150 m.
- Fault planes dip at 45-60 degrees from horizontal.
- Throws range between 10-15 ms.
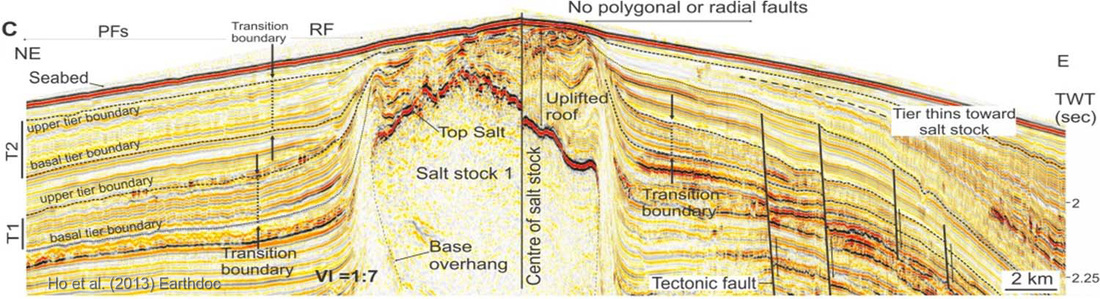
Fig 1.1.(a-b) (Upper right) - Dip map showing isotropic arrangement of polygonal faults in each tier. c) (Above) Arbitrary seismic line intersecting NE and E flank of Salt Stock 1 and showing the variable thickness of PF tiers. See position of line on Fig 3d. The transition from radials (RFs) to PFs is denoted by the transition boundary. The pinch-out of Tier 1 is indicated by the dashed line.
1.2 Genesis and mechanics of PFS
- Polygonal fault systems (PFS) are densely spaced and laterally extensive arrays of layer-bound normal faults which define polygonal plan forms (fig. 1.2) (Cartwright and Dewhurst, 1998).
- PFS have been discovered in over 100 sedimentary basins (Cartwright 2011 and therein) .
- PF’s are consistently developed within very fine-grained sediments such as claystones, shales, diatomaceous ooze, marls and fine-grained carbonates.
- PFS are unique in that they form in subsiding sedimentary basins free of lateral tectonic forces (Goulty, 2001).
- They are thought to form by contraction-driven shear failure during the early stages of sediment compaction and dewatering (Cartwright and Lonergan, 1995; Cartwright, 2011).
- Fault initiation and growth can occur at burial depths between 100-800 m (Cartwright, 2011) .
- We follow previous interpretation of PF growth and suggest that PFs ceased growing at the close of sedimentation of the tier (Cartwright and Lonergan, 1996).
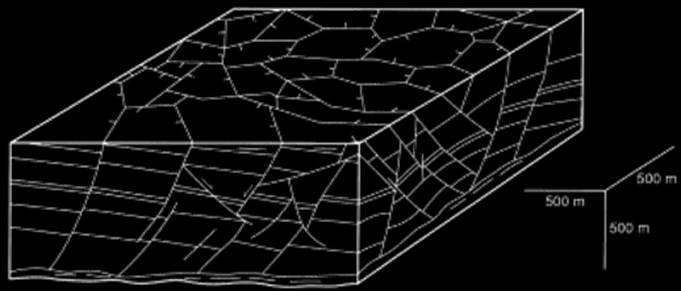
Fig 1.2. The 3D block diagram of the lower to middle portion of a layer-bound polygonal fault system developed in the Tertiary mud rocks of the Central North Sea (UK). Taken from Cartwright and Lonergan (1996).
Interpretation of stress state
During one-dimensional consolidation of the sediment layer;
- The maximum compressive stress (Sv) is vertical (fig. 1.3).
- The intermediate (SH) and least compressive stresses (Sh) are horizontal (Terzaghi and Peck, 1948) (fig. 1.3).
- The lack of strongly preferred fault strikes in PFS implies that the horizontal stress is effectively isotropic over large areas of basins where polygonal faults form (Cartwright, 2011; Goulty, 2001).
- In regions where polygonal faults have preferred strike orientations we infer that the state of stress was anisotropic.
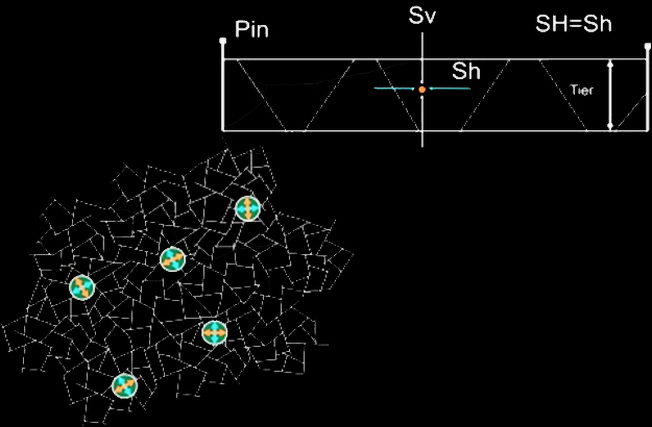
Fig 1.3. Orientation of vertical and horizontal stresses acting on a horizontal sequence of sediments undergoing gravity loading. Isotropic stress field defined by stress circles with aspect ratios of principle axes equal to 1. SH = Blue, Sh = red.
1.3. Ladder fault patterns
- Polygonal faults frequently define ladder-type patterns as in fig. 1.4.
- Unidirectional, long faults are referred to as first-order Pfs.
- Shorter orthogonal faults are called second-order Pfs.
- Both first- and second-order PFs are confined to tiers.
- First-order faults segments have aspect ratios exceeding 30-60.
- Second-order faults segments have the same lengths as PFs in purely isotropic arrangements (100-200 m).
- We regard first-order PF as having formed by contraction but have formed preferentially and developed very long lengths at an early stage.
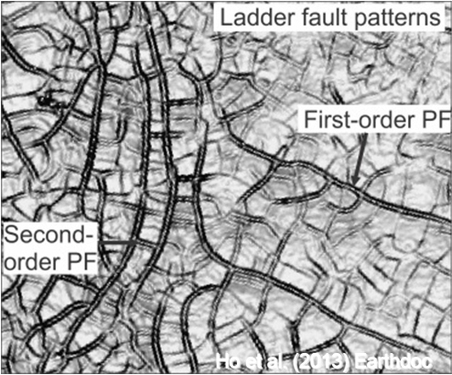
Fig. 1.4. Dip map showing ladder arrangement of PFS
|
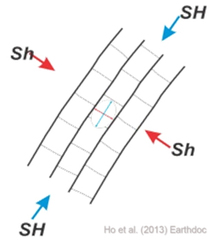
Fig 1.5. Interpreted stress ellipse required to generate ladder-style arrangements of polygonal faults. Bold lines define first-order PF and fine lines define second-order PFs.
|
1.4. Concentric fault patterns
1.4.1. Salt withdrawal synclines
- Polygonal faults switch to concentric fault patterns in salt withdrawal synclines (fig. 1.6).
- First-order PFs are aligned parallel to the strike of the basin perimeter.
- Second-order PFs tend to align perpendicular to concentrically aligned first-order PFs.
- Tier stratigraphy thickens into the withdrawal syncline suggesting salt withdrawal occurred during polygonal faulting.
- Tier stratigraphy is also intersected by some large, through-going normal faults interpreted as being tectonic in origin.
- Through-going tectonic faults formed during extension of the basin during salt withdrawal.
- The parallel relationship of first order PFs with through-going, tectonic faults suggests that the general stress state derived from the plan form polygonal fault expression was primarily influenced by local tectonic extension caused by salt withdrawal.
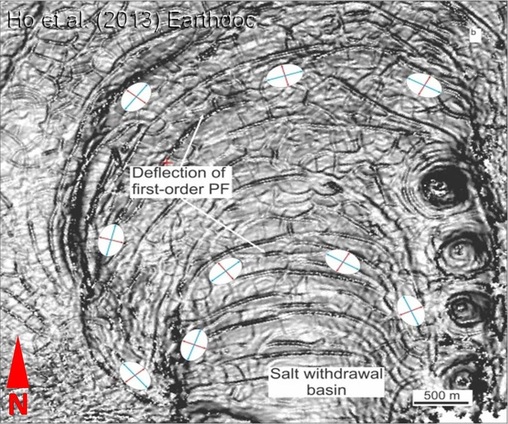
Fig 1.6. Dip map showing concentric arrangement of first-order polygonal faults in a salt withdrawal syncline.
1.4.2. Pockmark craters
- PFs switch to locally developed concentric faults (CFs) around and above pockmark craters located near the base of tiers (fig. 1.7a-b).
- The diameter of the concentrically faulted regions is ca. 600-1200 m.
- The diameter of the concentric pattern closely matches the diameter of pockmarks.
- Occasionally CFs occur outside of the immediate pockmark crater (Fig. 1.7a-b).
- The strikes of first-order PFs deflect around pockmarks or spiral toward the center of the pockmark crater (Fig. 1.7a).
- Thickening of stratigraphy into the pockmark crater at the base of the tier may indicate that collapse occurred during the earliest phase of polygonal faulting.
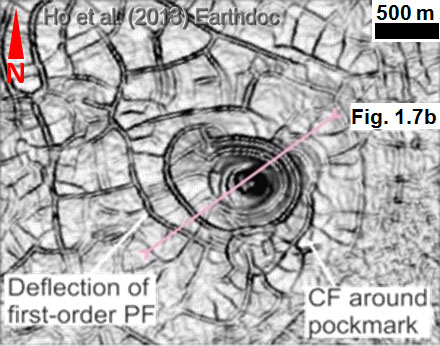
Fig 1.7. (a) Dip map of a horizon within Tier 2 showing PF patterns switching to Concentric faults (CFs) above a pockmark crater.
|
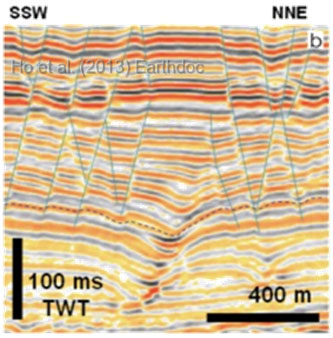
(b) Zoomed seismic section bisecting pockmark crater.
|
|
Interpretation of stress state The fault pattern indicates that the regional stress field was perturbed (fig. 1.8) so that;
The origin of the local stress regime may be explained by; a) Local, extensional collapse b) Introduction of stress anisotropy by gravity loading on an inclined basal tier surface. 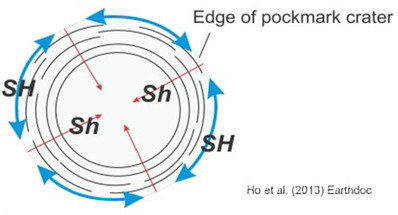
Fig. 1.8. Cartoon reconstruction of the stress state in sediments compacting above a pock mark crater grey shaded region. Blue arrows show concentric orientation of SH and red lines show radial orientation of Sh.
|
1.5. Radial fault patterns
1.5.1. Distribution of radial faults around salt diapirs
- Polygonal faults switch to closely spaced radial fault arrays centered on the two salt diapirs in the study area
- This is typical where salt diapirs have penetrated polygonally faulted layers (Davison et al ., 2000, Stewart, 2006, Andresen and Huuse, 2011; Carruthers, 2012)
- Previous studies include the Central North Sea and basins in the South Atlantic (Western Africa and SE Brazil).
- In this study we find that radial faults are not continuously developed around the entire flank of the salt diapirs (see fig. 1.9 below).
- The areas where radial faults are absent also correspond to regions where polygonal faults are absent (fig. 1.9).
- The absence of polygonal faults is related to the gradual pinch-out of tier stratigraphy (fig. 1.1c, 1.9).
- Since radial faults form by arching it is interesting that radial faults are not developed around the entire diapir flanks.
- Using this new data we support previous interpretations that closely spaced radial faults are in fact a preferentially aligned form of polygonal fault (Stewart, 2006, Carruthers, 2012).
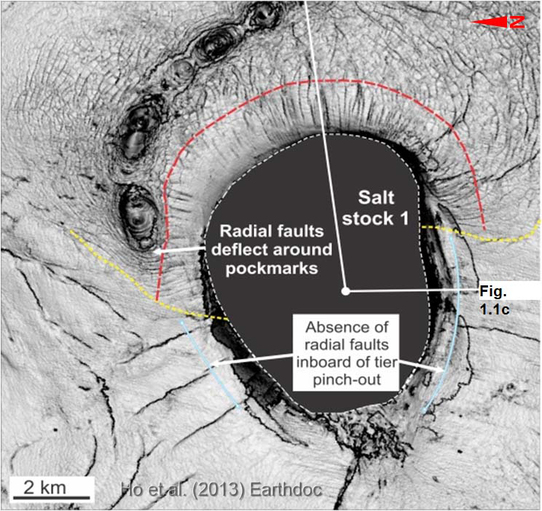
Fig 1.9. Dip map of horizon with Tier 2 around Salt Stock 2. Yellow line on 'd' define the pinch-out of PF Tier 2, red dashed line shows position of transition boundaries
1.5.2. Comparison to laterally equivalent polygonal faults
- RFs have the same spacing (100-230 m) as laterally equivalent PFs.
- Both radial and polygonal faults are confined to the same stratigraphic tiers.
- The throws on radial faults are comparable with laterally equivalent polygonal faults.
- The length of radial fault segments are up to 10 times longer that polygonal faults.
- There is no obvious increase in throw on radial faults toward the salt diapir.
- Many radial faults tip out where tier stratigraphy condenses to below the vertical resolution of the seismic data.
- The distribution of radial faults closely matches the distribution of radial faults.
- There is no evidence for clustering of radial faults around the flanks with greatest strike curvature which would is characteristic of arching-related radial faults.
- Based on these observations we class these intra-tier radial faults as having formed by contraction and compaction but in a stress field controlled by salt diapirism.
1.5.3. Radial-polygonal fault transition
In accordance with previous studies we find;
- The regional polygonal fault pattern switches abruptly to an inner array of radial faults (fig. 1.10a-c).
- The transition zone is c. equal to the length of PF segments.
- The transition zone mimics the plan form geometry of the salt diapir.
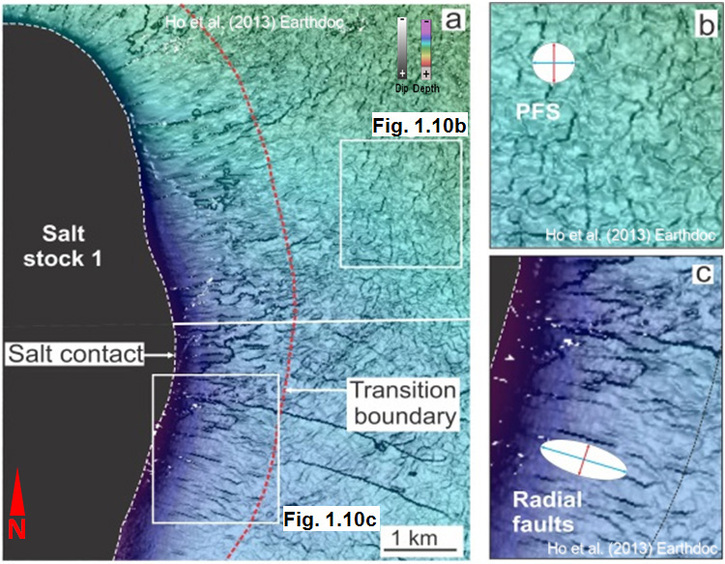
Fig 1.10. (a-c) Zoomed dip maps within Tier 1 showing RFs around Salt Stock 1.
In this study we observe the following differences to previous studies;
- First-order polygonal faults deflect toward the diapir to maintain normal relationship with the salt contact, i.e. radial geometries.
- The transition zone is defined by two boundaries;
- An outer boundary marking the onset of deflection in the strikes of first-order PF toward the salt diapir.
- An inner boundary denoting the change from ladder patterns to purely radial faulting.
- The transition zone is composed of first-order PF segments which are normal to the salt diapir and second order PF segments which are tangential to the salt diapir.
- Radial faults deflect around locally developed pock mark craters to define a hybrid radial-concentric fault (fig. 1.11a-b).
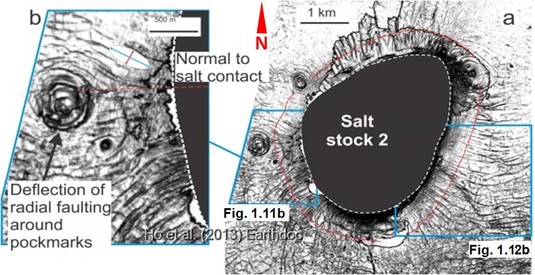
Fig. 1.11. (a-b ) maps within Tier 2 showing CFs around pockmarks next to Salt Stock 2. Red dashed line shDip ows position of transition boundaries .
Interpretation of stress state
- Isotropic polygonal fault patterns and ladder fault patterns formed in isotropic and weakly anisotropic stress field respectively.
- Radial faults formed in a hoop stress field relating to the salt diapir (fig. 1.12a).
- The transition between radial and polygonal faults defines the limit of the hoop stress field at the time of faulting (fig. 1.12b).
- Following the interpretation of Carruthers 2012 we suggest that the hoop stress field is characterised by a combination of radial loading of the pressurised salt stock and arching stresses caused by doming of the diapir flanks.
- Deflections of first-order PFs provide an indication of stress trajectories at the time of faulting and constrain the lateral extent of the local hoop stress field associated with the salt stocks.
- The region between the inner and outer transition boundaries was under the influence of the local hoop stress field but the difference in magnitude of the horizontal principle stresses was likely to be small.
- Inboard of the inner transition boundary the minimum horizontal stress is more significantly reduced with respect to the maximum horizontal stress.
- Previous studies showed the transition boundary occurred at 2-4 diapir radii from the salt contact (Carruthers, 2012).
- In this study the outer transition boundary occurs only 0.5 diapir radii from the salt contact highlighting the complexity of the near salt stress field and the variability in its lateral distance from the salt contact.
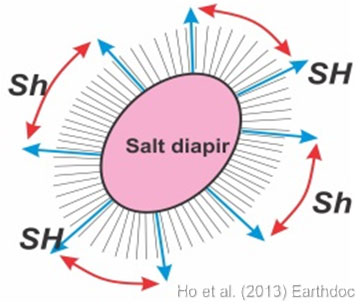
Fig 1.12. (a) State of stress around a salt diapir (pink shaded area) inferred from radial arrangement of polygonal faults. The stress state is defined by a concentric or hoop oriented Sh and radially oriented SH. The difference in magnitude between SH and Sh decays with distance from the salt diapir and transitions to conditions of the regional stress state.
|
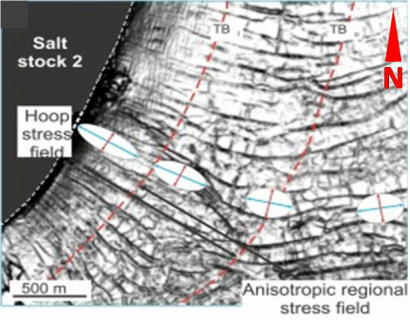
(b) Zoom of the transition zone showing deflection of first-order PFs. Interpreted stress ellipses show reduction and elevation of Sh and HS respectively toward the salt stock. Red dashed line shows position of transition boundaries TB.
|
II. Linear positive high amplitude anomalies (PHAAs) superimposed on polygonal fault trends
2.1. Plan form geometry of linear positive high-amplitude anomalies (PHAAs)
- Linear positive high amplitude anomalies (PHAAs) follow the tends of polygonal fault networks (fig. 2.1 & 2.2).
- PHAAs are characterised by peaks over toughts (fig. 2.3) indicating a "seismically hard material".
- PHAAs have negative relief < 7 ms TWT (fig. 2.4). Morphology suggests PHAAs resulted from fluid seepage.
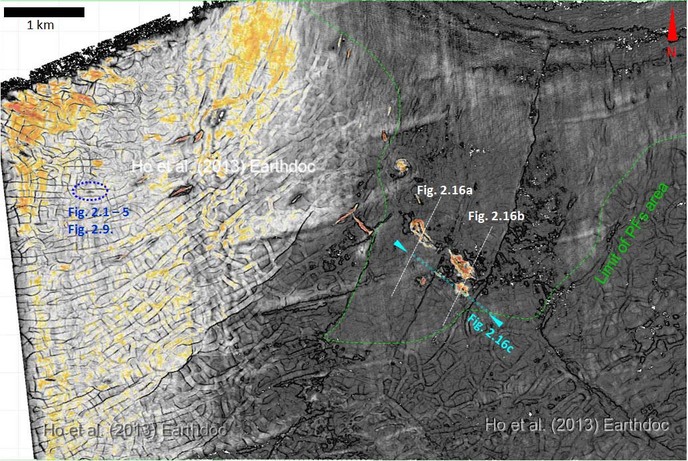
Fig. 2.1. Amplitude map of the upper boundary of polygonal fault tier (PFT) showing linear PHAAs wihtin the polygonally faulted area (PFs) area, and oval-to-elongate PHAAs ouside the polygonally faulted area. See location on Fig. 2.7.
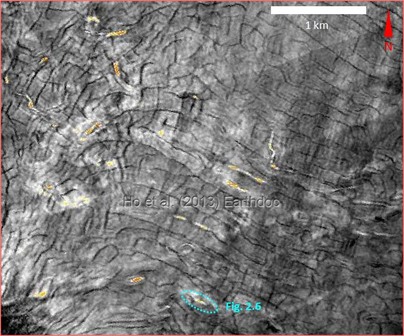
Fig. 2.2. Amplitude map showing linear PHAAs following the tend of isotropic and anisotropic PFs. See location on Fig. 2.7.
|
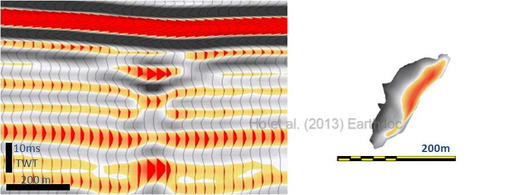
Fig. 2.3. (Left) Seismic wriggles of a linear PHAA. See location on Fig. 2.1;
Fig. 2.4. (Right) The 3D view of linear PHAA in fig. 2.3.
- PHAAs are often occur above vertical columnar structures i.e. pull-up acoustic chimneys (fig. 2.5) or negative, high-amplitude bright spots (columns) (fig. 2.6) with PFs tier.
- Linear PHAAs stack above linear negative bright sport and form a vertical succession (fig. 2.6 & 2.7).
- Negative high amplitudes (fig. 2.8) are interpreted as free gas accumulations.
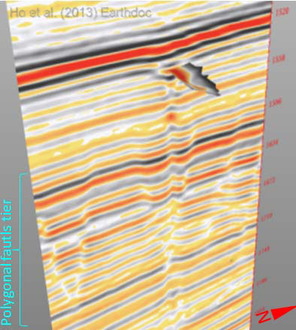
Fig. 2.5. The Linear PHAAs are associated with seismic pull-up indicating a "seismic fast material". 3D view of fig. 2.2. and 2.3.
|
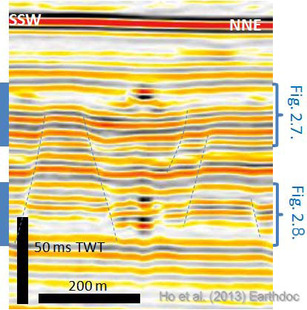
Fig. 2.6. (Right) The linear PHAAs associate with negative bright spot column. Location see Fig. 2.2 and Fig. 2.7-8.
|
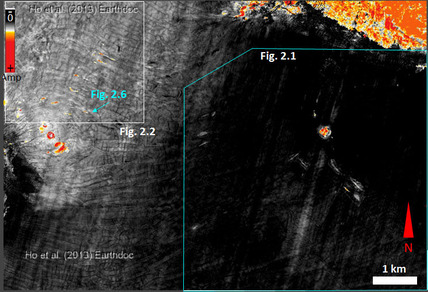
Fig. 2.7. Map of a 100 ms thick amplitude window in the upper part of the PF tier. See cross section through interval on Fig. 2.6.
|
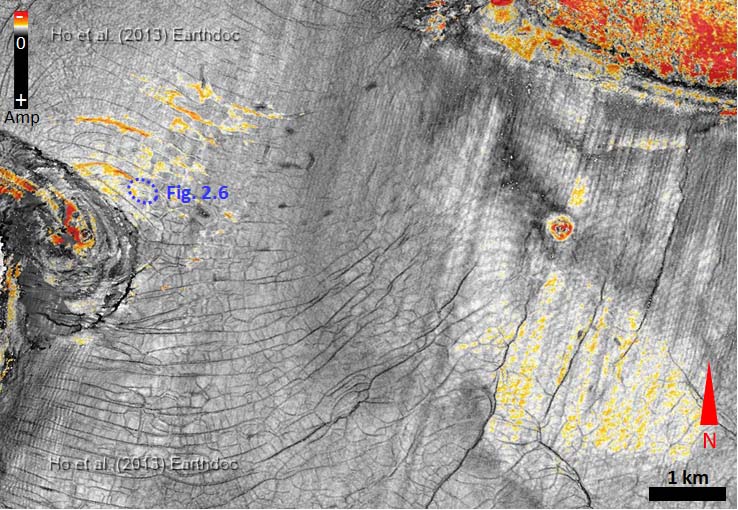
Fig. 2.8. Map of a 15 ms thick amplitude window of the lower part of PF tier. See cross section through interval on Fig. 2.6.
|
2.2. Internal views of linear chimney
These seismic columns (fig. 2.5 & 2.6 & 2.9) that occur along the central axis of polygonal fault grabens are interpreted as hydraulic fractures (Ho et al., 2012).
Columnar structures are linear in plan view (see linear dim zones on horizons in fig. 2.8 & 2.10).
Columns containing negative bright spots located within PFs grabens (fig. 2.6), it is suggested that free gas accumulates at the lower part of the hydraulic fractures.
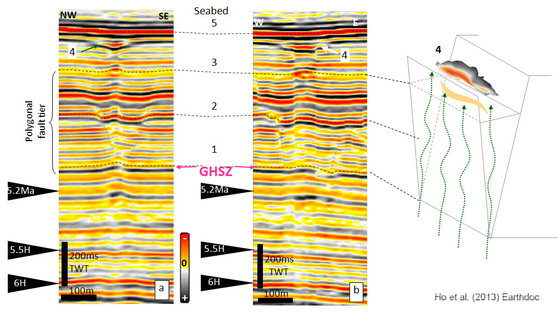
Fig. 2.9. Linear positive high-amplitude anomalies (PHAAs) are alligned parallel to the strikes of polygonal fault grabens. (a) latitudinal section and (b) longitudinal section of linear PHAA in fig. 2.4. see location on fig. 2.1.
|
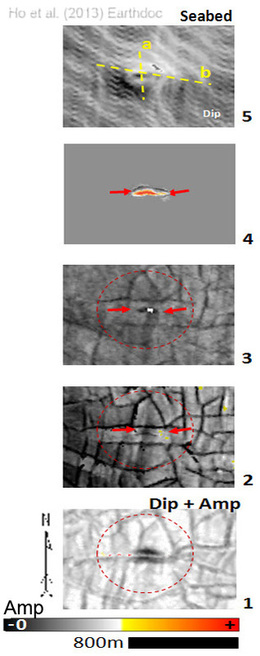
Fig. 2.10. Seismic chimenys that terminate upward into linear PHAAs show linear amplitude dim zone on horizons which intersect the vertical chimneys.
|
2.3. Methane-derived authigenic carbonate (MDAC)
PHAAs in this survey are interpreted as methane-derived authigenic carbonate (MDAC) and when located in the gas hydrate stabilization zone are potentially asssociated with gas hydrate (Fig. 2.11).
MDAC formed as a result methane-rich fluids migrating through the hydraulic fractures.
MDAC formed as a result methane-rich fluids migrating through the hydraulic fractures.
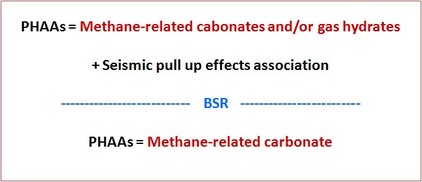
Fig. 2.11. Interpretation of PHAAs as MDAC.
|
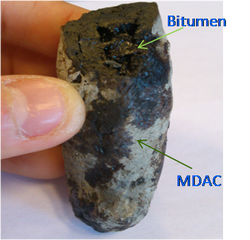
Fig. 2.12. MDAC chimneys with inclusions of liquid hydrocarbon inside. Sampled in 2011 from the present day seafloor in the Lower Congo Basin.
|
MDACs (see Fig. 2.12) result from anaerobic methane oxidation (AMO) (1) + calcite precipitation (2) (Regnier et al., 2011):

Reactions take place in the sulphate–methane transition zone (SMTZ) (fig. 2.13): 1 cm to 10s m below the seafloor = Indicator of methane escaping at palaeo seabed.
Linear PHAAs are suggested to represent slow seepage rates (Ho et al., 2012).
The reflection or stratigraphic level at which PHAAs/methane-related carbonates occur represent sites of hydrocarbon leakage on the palaeo seabed (Ho et al., 2012).
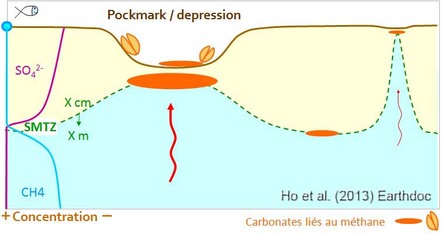
Fig. 2.13. Conceptuel model for the formation of MDAC.
2.4. Sub-circular PHAAs above linear seismic chimney
THIS PART HAS BEEN BLANKED OUT FOR COPYRIGHT REASON
2.5. Hydraulic fractures and the resulted methane-related carbonates
Hypothesis for formation of hydraulic fractures:
Hypothesis for formation of hydraulic fractures:
- Linear fluid flow conduits formed by propagation of hydraulic fractures at basal apex of polygonal fault grabens, where is likely to be the first weak zone that fluid encountered.
- Dim zones at the base of PF occur parallel to and along the central axis of the conjugate PF graben.
- During polygonal faulting the maximum horizontal stress (SH) and minimum horizontal stress (Sh) is parallel and perpendicular to fault strike.
- If fluid pressure exceeds Sh plus tensile strength of host rock, hydraulic fractures propagate perpendicular to Sh. This forms vertical fracture planes located in the central axis of conjugate PF grabens and striking parallel to PFs.
2.6. Non-linear fluid venting structures
THIS PART HAS BEEN BLANKED OUT FOR COPYRIGHT REASON
THIS PART HAS BEEN BLANKED OUT FOR COPYRIGHT REASON
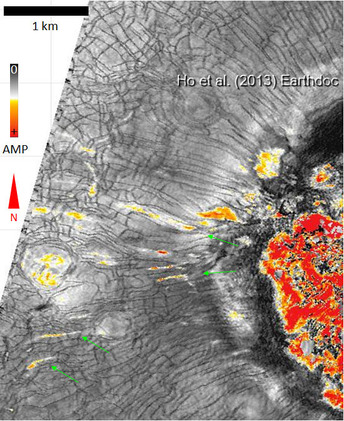 Fig. 2.19. Amplitude of fig. 1.11a.
2.7 Further evidence for the role stress anisotropy and faulting on the geometry of fluid venting structures
Linear PHAAs are also parallel to radially aligned polygonal faults (fig. 2.19).
THIS SECTION HAS BEEN PARTLY BLANKED OUT FOR COPYRIGHT REASON
Linear PHAAs are also parallel to radially aligned polygonal faults (fig. 2.19).
THIS SECTION HAS BEEN PARTLY BLANKED OUT FOR COPYRIGHT REASON
3. Conclusions
- We have demonstrated that the planform geometry of PFs is anisotropic in the vicinity of salt stocks and fluid venting structures.
- We interpret the anisotropy to reflect perturbations in the regional stress field by local stresses related to diapirism and fluid venting.
- The geometry and location of fluid venting structures is controlled by the location of PF intersections and the local state of stress.
- The build up of fluid overpressure adjacent to PF caused hydrofractures to develop.
- Perturbations of the regional stress field around PFs caused hydrofractures to open and propagate with a preferred orientation. i.e. parallel to strikes of PFs.
- The anisotropic, local stress field around PF’s was thus a key control on the linear geometry of fluid venting structures.
- THIS SECTION HAS BEEN PARTLY BLANKED OUT FOR COPYRIGHT REASON
References
Bourne, S., Franz, B., Lex, R., Stephenson, B., Alex, W., Willemse, E. [2000]. Predictive modelling of naturally fractured reservoirs using geomechanics and flow simulation. In Abu Dhabi International Petroleum Exhibition and Conference.
Cartwright, J., [2011]. Diagenetically induced shear failure of fine-grained sediments and the
development of polygonal fault systems. Marine and Petroleum Geology. 28(9), 1593-1610.
Carruthers, T.D., [2012]. Interaction of polygonal fault systems with salt diapirs . PhD thesis, Cardiff University.
Coffeen, J.A., 1978, Seismic Exploration Fundamentals: The Use of Seismic Techniques in Finding Oil, 277p.
Goulty, N., [2001]. Mechanics of layer-bound polygonal faulting in fine grained sediments. Journal of Geological Society 159(3), 239-246.
Ho, S., Cartwright, J. A., Imbert, P. [2012]. Vertical evolution of fluid venting structures in relation to gas flux, in the Neogene-Quaternary of the Lower Congo Basin, Offshore Angola. Marine Geology.
Rawnsley, K., Wei, L. [2001]. Evaluation of a new method to build geological models of fractured reservoirs calibrated to production data. Petroleum Geoscience, 7(1), 23-33.
Regnier, P., Dale, A. W., Arndt, S., LaRowe, D. E., Mogollón, J., Van Cappellen, P., [2011]. Quantitative analysis of anaerobic oxidation of methane (AOM) in marine sediments: A modeling perspective Earth Science Reviews, v. 106, iss. 1-2, p. 105-130.
Roberts, H. H., [2001]. Fluid and gas expulsion on the northern Gulf of Mexico continental slope : Mud-prone to mineral-prone responses. Geophysical Monograph, v. 124, p. 145-161.
Terzaghi, K., Peck, R.B., Mesri, G., [1948]. Soil Mechanics in Engineering Practice, Wiley. New York.

Fluid-Venting-System website by S. HO is licensed under a Creative Commons Attribution-NonCommercial-NoDerivatives 4.0 International License.