

Ho, Sutieng 2013. Evolution of complex vertical successions of fluid venting systems during continental margin sedimentation. PhD Thesis, Cardiff University.
Download file
Download file
Variations of methane flux and formations of pockmark, chimneys and methane-related carbonates: vertical successions of fluid leakage features, Offshore Angola
(This work is published by Ho et al. 2012 under a different title due to the copyright reason. PDF of this published paper can be download by clicking on the icon in top right)
Key words: Sutieng Ho, pockmark, Sutieng Ho, gas chimney, seismic polygonal fault, methane authigenic carbonate, Lower Congo Basin Angola
Sutieng Ho *1, J.A. C. 1, Patrice Imbert 2
1 (Previously) Cardiff University, Cardiff CF10 3AT, Wales, United Kingdom
2 Total CSTJF, Avenue Larribau, 64000 Pau, France
*[email protected]
1 (Previously) Cardiff University, Cardiff CF10 3AT, Wales, United Kingdom
2 Total CSTJF, Avenue Larribau, 64000 Pau, France
*[email protected]
Abstract
The processes preceding the genesis of pockmarks and their subsequent evolution has been rarely studied since pockmarks were discovered in 1970. A high-resolution 3-D seismic survey from the continental slope of the Lower Congo basin allows us to study in detail the structures that developed before the formation of pockmarks, as well as their subsequent geometric evolution.
This paper aims at reporting new type of fluid-related structures that relate to pockmarks. The objective of this research is to understand: 1) the evolution of these structures and their genetic relationship with pockmarks, and 2) how their morphologies may be influenced by changes in venting intensity over time.
Pockmark and chimney structures in this survey are hosted within Late Miocene to Quaternary hemipelagites, above clastic reservoirs in a petroliferous basin. They are all associated with positive high amplitude anomalies (PHAAs) on seismic data. PHAAs are interpreted from their dramatically higher acoustic impedance relative to the background sedimentary values of the host units, and by their association with seismic pull-up effects. From their planform and cross-sectional geometry, PHAAs are primarily interpreted as being due to the development of methane-related carbonates but they may be associated with gas hydrates in one or two examples.
Methanogenic carbonates form either by authigenic accumulation or by anaerobic methane oxidation (AMO) once upwardly migrating methane enters the sulfate-methane transition zone (SMTZ), typically within the first few tens of meters below the seabed. Therefore, vertical accumulations of PHAAS are interpreted to reflect the temporal evolution of methane flux migrating upward to reach the paleo-seabed or SMTZ. Timing of local scale fluid leakage can therefore be diagnosed by analyzing PHAAs at seep locations that occur in association with pockmark/chimney structures.
A conceptual model for the evolution of different fluid venting structures is proposed here, and is based on the analysis of venting structures that we expressed by 3-D seismic reflections. In this model the main features are linked into a process-based sequence, culminating in the infill and termination of the pockmarks as fluid venting sites. Our model summarizes different rhythms of venting which are expressed by different types of PHAAs along with venting structures. Linear PHAAs and conduits inferred slow seeps. They can be succeeded by sub-circular PHAAs and shallow depressions which inferred slow to moderate seeps. Then the seep can become either a fast vent and terminated into a pockmark crater; or it can become less active and be sealed afterwards. Subsurface sediment fluidizations and remobilizations are likely to happen in the last case and are probably caused by hydrate dissociations.
1. Introduction
Pockmarks, chimney structures and interpreted methane-related carbonates have been observed in the Late Neogene/Quaternary interval of the Lower Congo Basin (Gay, 2002, Charlou et al., 2004, Olu-Le Roy et al., 2007 and Pierre and Fouquet, 2007). These types of structure represent different degrees of fluid flux and provide general indications of fluid migration pathways in the subsurface (Hovland and Judd, 1988 and Berndt, 2005Gay et al., 2003, Cartwright et al., 2007 and Andresen et al., 2011), hence caprock leakage or underlying reservoir locations can be detected (Heggland, 1997 and Gay et al., 2003).
Once hydrocarbons breach a caprock, they can leave behind trails that relate to the mode of expulsion at the time of fluid escape. However, the question of how the fluid migration phenomena evolve both at the seabed and the immediate sub-surface over time, has only rarely been addressed. The geometrical evolution of venting structures may potentially reflect the longer term dynamics of fluid leakage, because each fluid expulsion episode creates recognizable and characteristic topographic features at seep locations, thereby affecting later sediment accumulation. Thus overpressured fluid expulsion events can be reconstructed at least qualitatively by analyzing in detail the architectures of each venting structure. For this purpose, a basic framework for surface and subsurface expressions of fluid expulsion has been presented by Roberts (2001) and Roberts et al. (2006). The general framework for classifying surface expressions of fluid dynamics according to variations in gas flux of Roberts (2001) and Roberts et al. (2006) will be used as a starting point for our study.
Subsurface expressions of fluid escape in our survey are found principally in the Late Neogene/Quaternary interval in the Lower Congo Basin. The following fluid escape features are recognized: (1) seismic chimneys (cf. Løseth et al., 2001 and Løseth et al., 2011Moss and Cartwright, 2010a and Moss and Cartwright, 2010b) are considered to be an indicator of gas seepage from deeper reservoirs (Heggland, 1997) and defined as a specific class of seal bypass system by Cartwright et al. (2007); (2) pockmarks (cf. Hovland, 1981 and Gay et al., 2003), they exhibit more elaborated internal organizations than the simple v-shape pockmarks of King and MacLean (1970) in our survey; (3) Positive high amplitude anomalies: the interpreted methanogenic carbonates in our survey, they occur at pockmarks or seismic chimneys locations.
The relationship of hydrocarbon leakage flux to different leakage indicators and sedimentary structures, has become an increasingly popular research theme in the last two decades (cf. Hovland, 1981, Heggland, 1997, Roberts, 2001, Gay et al., 2003 and Cartwright et al., 2007). Methane-related carbonates (and fauna) at cold seep sites have also been intensely studied since the eighties (cf. Hovland et al., 1984, Campbell and Bottjer, 1993, Roberts, 2001, Aiello, 2005, De Boever et al., 2006 and Mazzini et al., 2008). The build-up of carbonate-rich benthic chemosynthetic communities are manifestations of active fluid migration near the seabed (Hovland, 2008), and the quantity of carbonate in the buried seepages reflects the intensity of fluid flux (Gay et al., 2007 and Naudts et al., 2010). Cold seep carbonates on pockmark floors were first studied in the 1980's in the North Sea, where they appear as highly reflective patches on side-scan sonar (Hovland and Judd, 1988). The first pockmarks associated with methanogenic carbonate were discovered in the North Sea in 1981 by side scan sonar (Hovland, 1985 and Hovland et al., 1987), and by a remote-operated vehicle in 1983 (Hovland and Sommerville, 1985, Hovland et al., 1987, Hovland and Judd, 1988, Hovland and Thomsen, 1989 and Judd and Hovland, 2007).
Both methanogenic carbonates and gas hydrates are high velocity materials (Ecker et al., 1998, Hustoft et al., 2007, Westbrook et al., 2008, Chand et al., 2009 and Petersen et al., 2010). They create strong acoustic impedance contrasts at their interface with the surrounding/overlying softer layer, and result in positive high amplitude anomalies (PHAAs) on reflection seismic data. PHAAs have been reported in a number of recent publications, as high amplitudes (reflections) or anomalies in the diverse settings: (1) within craters (Heggland, 1998); (2) at a pockmark bottom (Cauquil et al., 2003), (3) at the seafloor above pipe structures (Hustoft et al., 2007); (4) in the deeper lunate part or in the central elevation of a pockmark (Andresen et al., 2008); (5) on the seabed along a pockmark fringes (Chand et al., 2009); (6) immediately adjacent to or within pipes (Moss and Cartwright, 2010a and Moss and Cartwright, 2010b); and (7) at the top of pipes (Petersen et al., 2010).
However, the detailed geometry of PHAA has barely been discussed: their evolution at seep locations has not previously been analyzed using seismic data, nor has their specific spatio-temporal relationship with pockmarks or other venting structures been examined.
We will demonstrate in this paper, the vertical occurrence of PHAAs within venting systems has considerable value for determining the timing at which fluids reach the near the seabed. We will propose in our conclusion, a conceptual model that exhibit the genetic relationships and the evolutionary sequence, which are suggested by the geometric complexity and the vertical position of PHAAs within different venting systems.
Therefore in this study we aim to: 1) determine the role of PHAAs during the evolution of venting structures; 2) reconstruct qualitatively the steps that comprise the basic process of how a pockmark grows from low flux seepage, by integrating the geometrical development of PHAAs over time; 3) try to re-establish the relationships between flux rates and the types of venting features and to develop a theoretical sequence for the evolution of venting structures.
2. Data and methods
A high-resolution 3-D seismic survey was provided by Total S.A. The 3-D dataset covers an area of 425 km2 in water depths of ca. 1150–1540 m with a bin size of 6.25 × 6.25 m. The acquisition direction (NNW–SSE) is not aligned with the long axis of any studied fluid venting structures, so there are no spatial aliasing problems with the imaging of shallow features.
For the target interval of this study the average peak to trough distance is 8 ms TWT. This corresponds to a vertical resolution approximately 3–4 m at a near-seabed velocity of 1700 ms− 1. The seismic data are zero phased and the downward increase of acoustic impedance is represented by positive amplitude values. The seismic data were interpreted with the IESX GeoFrame© 4.0 software developed by Schlumberger and the Sismage© software developed by Total. Mapping of all fluid-related structures was carried out manually on a line-by-line basis, to ensure the maximum resolution of the finer structure and amplitude variation. These structures were examined in arbitrary line transects in a full 360 degree pattern centered on the fluid related structures using differently processed cubes of the seismic volume (near, middle and far offset cubes). Seismic attributes such as the dip of picked horizons, RMS amplitude, and minimum and maximum amplitude within specific two-way time windows from a mapped horizon were calculated and were used in our interpretations. Interpretation of windowed amplitude maps was undertaken with careful calibration with the seismic data to ensure that tuning effects were correctly identified (Widess, 1973 and Kallweit and Wood, 1982).
3. Regional geological setting
The study area is located offshore Angola, in the Lower Congo Basin (Fig. 1). This basin results from the opening of the South Atlantic in the Early Cretaceous (Mascle and Phillips, 1972 and Larson and Ladd, 1973). The interval of interest i.e. the Cenozoic succession, is dominated by extensional gravity tectonics over the mobile salt (Duval et al., 1992), and is constituted mainly by siliclastic deposits (Liro and Dawson, 2000, Lavier et al., 2001 and Séranne and Anka, 2005 ).
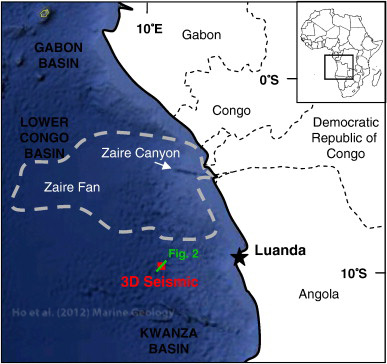
Fig. 1.
Location map of the study survey in Lower Congo Basin, Offshore Angola.
Major uplift of the hinterland occurred during the Late Oligocene/Early Miocene (Walgenwitz et al., 1990), exposed the shelf and led to redistribution of sediment into deeper parts of basin (Broucke et al., 2004) in the form of turbidites and debris flow deposits (Droz et al., 1996, Anderson et al., 2000, Cramez and Jackson, 2000, Anka and Séranne, 2004, Anka et al., 2009 and Savoye et al., 2009).
Abundant channel-levee systems transported coarser clastics across the upper slope region of the margin during Early and Late Miocene (Anderson et al., 2000), and these were interbedded with hemipelagites and mass transport deposits (Anderson et al., 2000 and Broucke et al., 2004).
The Miocene/Pliocene boundary coincides with an accelerated margin uplift in the late Miocene (Frerichs and Shive, 1971 and Lavier et al., 2001). In addition to the salt tectonic instability, these conditions led to the incision of the Congo Canyon which in turn restricted turbidite deposits to the lower slope and abyssal plain (Anka and Séranne, 2004 and Anka et al., 2009) while the shelf and upper slope above salt were bypassed. As a result sedimentation on the outer shelf and slope are dominated by hemipelagite deposition until the present time (Anka et al., 2009).
3.1. Stratigraphy of the study area
The study area is located in the extensional domain of the continental slope with a water depth of ca. 1300 m (Fig. 2). The stratigraphic interval of interest is the Quaternary-Neogene, within the upper kilometer of the basin fill, and is dominated by hemipelagites (Vignau et al., 2000). When calibrated by biostratigraphy, seismic horizons were given a name reflecting their age according to the Berggren chart (Berggren et al., 1995 and Vignau et al., 2000). Horizons without age calibration were named (e.g. 6 H, 6.3 H) to reflect the interpolated age estimated using averaged sedimentation rates between the calibrated horizons.
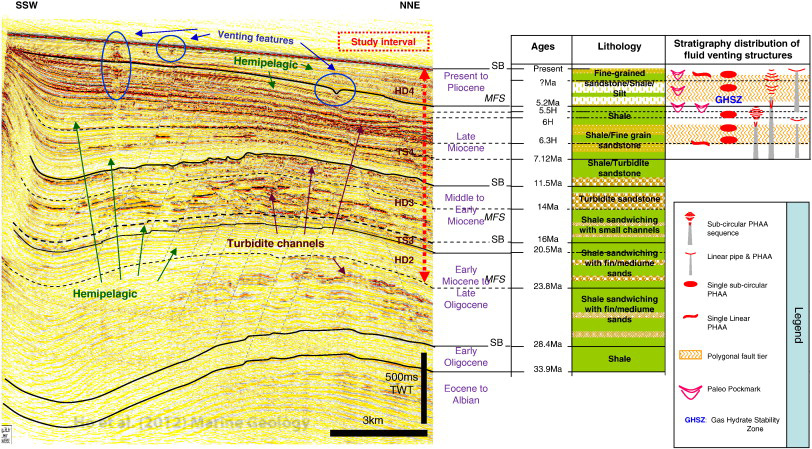
Fig. 2.
Seismic line from the 3-D survey (location see Fig. 1) and seismic stratigraphy, showing the stratigraphy of the Cenozoic and the intervals of interest, and the distribution/lithological context of fluid venting structures. HD: hemipelagic deposits; TS: turbiditic system; SB: sequence boundary; MFS: maximum flooding surface.
The studied interval is divided into several units based on the occurrence of two main seismic facies: (1) moderate amplitude, parallel, continuous reflections interpreted as hemipelagic deposits (HD4, 3, 2) (Broucke et al., 2004); and (2) high-amplitude, lower continuity packages encased in low-amplitude intervals interpreted as turbidite systems (TS4, 3) (Fig. 2) (Broucke et al., 2004).
The detailed lithostratigraphy for the Neogene is based on Vignau et al. (2000). The studied interval is subdivided as follows (Fig. 2):
1.HD4, 0 Ma–5.2 Ma; two sub units have been distinguished. The unit overlying the polygonal fault tier contains continuous internal reflections with low-to-moderate acoustic amplitudes. The interval has been reported to comprise hemipelagites (Vignau et al., 2000) until the base of the unit which occurs at the top of a polygonal fault tier as defined by (Sensu Cartwright and Dewhurst, 1998). The base of gas hydrate stability zone (GHSZ) observed locally in the area approximately coincides with the base of the polygonal fault tier, at 200 ms TWT below the seafloor, at a horizon dated as the Base Pliocene (5.2 Ma).
2.TS4, 5.2 Ma–11.5 Ma; was subdivided into three sub units, a) 5.2 Ma–6 H (H: Horizon with interpolated age but no age calibration) very continuous clay-rich sediments, b) 6 H–6.3 H deeper level polygonal fault tier composed of claystones/fine-grained sandstones interval which overlays locally fine-grained turbidites, c) 6.3 H–11.5 Ma silty claystone units containing coarse-sand bodies.
3.HD3, 11.5 Ma–16 Ma; strongly layered claystone/fine-grained sandstone beds interbedded with fine to medium turbidites interbedded with.
4.TS3, 16 Ma–20.5 Ma; well bedded fine-grained sandstone alternating with claystone.
5.HD2, 20.5 Ma–23.8 Ma; claystone and well bedded fine-grained sandstone.
4. Seismic expression and interpretation of fluid venting structures
4.1. Types of fluid venting structures
All the fluid venting structures in this part of the Lower Congo Basin are hosted in hemipelagic sediments of Late Miocene to Recent age. They principally occur above or within the interval affected by polygonal faults. Based on the morphology and seismic characteristics of these structures, we have grouped them into three families: 1) positive high amplitude anomalies (PHAAs), 2) seismic pipes and 3) pockmarks. PHAAs were observed to always be associated with the last two features.
4.2. Positive high amplitude anomalies (PHAAs)
Two main types of PHAAs were distinguished on the basis of their planforms: sub-circular and linear (Fig. 3A). They appear on amplitude maps as strong, sharply bounded high amplitude regions in a generally low background amplitude value. Both sub-circular PHAAs and linear PHAAs are mainly observed within the interval from the 7.3 Ma marker to the seabed. Linear PHAAs usually occur at a single high amplitude reflection in seismic sections and are associated with acoustic pipes. In contrast, sub-circular PHAAs mainly occur as stacked vertical successions, so that they will be described in this context.
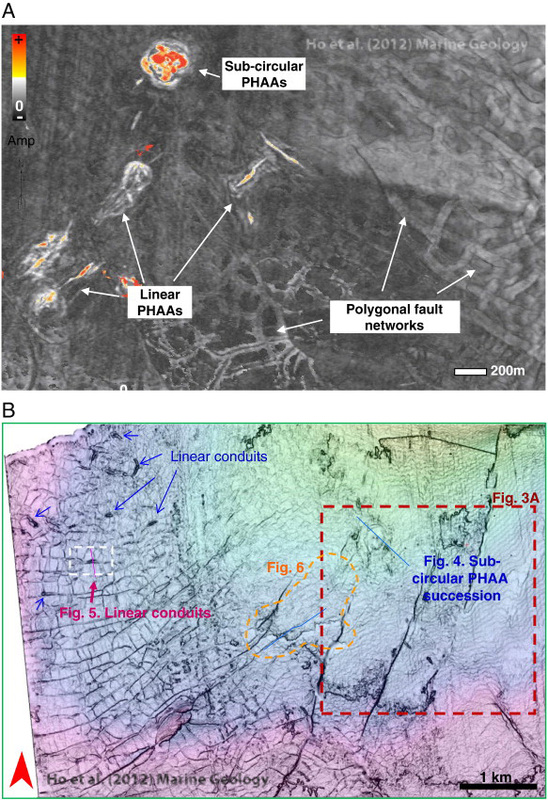
Fig. 3.
Distribution of PHAAs in the study area. (A) A 20 ms TWT thick amplitude window above the top boundary of polygonal fault tier shows two types of PHAA: sub-circular and linear. Notice that linear PHAAs follow the trend of polygonal faults. (B) A dip horizon shows the locations of the two types of PHAAs coincide with the polygonal fault network and regional faults.
The dip horizon of Base Pliocene (TS4, Fig. 3B) shows the PHAAs are distributed parallel to or along the strike of polygonal faults, or in some cases coincide with the positions of deeper-seated tectonic faults, in contrast to the context for chimneys reported by Gay et al. (2004). However, no venting structures in the study area were observed to lie above the triple junction of polygonal cells (Gay et al., 2004).
4.2.1. Definition and description of sub-circular PHAAs
Sub-circular PHAAs can be regular or irregular, nearly circular or elliptical in planform. They can be morphologically flat but most of the time they are associated with near-circular depressions.
A representative example of a series of sub-circular PHAAs stacked up vertically to form a high amplitude sequence is presented in Fig. 4. Stacked amplitude anomalies seen on seismic profiles (e.g. Fig. 4A) are observed to consist of sub-circular to elliptical planforms in the set of amplitude maps from this example (Fig. 4B). This stack of amplitude anomalies is located at the top of deep-seated normal faults which are larger than polygonal faults and which intersect the upper and lower boundary of the polygonal fault tier. The larger faults are regarded as being tectonic in origin as vertical extent and displacement cannot be explained by the layer-bound compaction which formed the polygonal faults. The anomalies terminate upwards in a circular depression 200 m in diameter at the present day seabed. The anomalies are also associated with a pockmark below with a chaotic infill, and are interpreted to produce an acoustic wipe-out zone below.
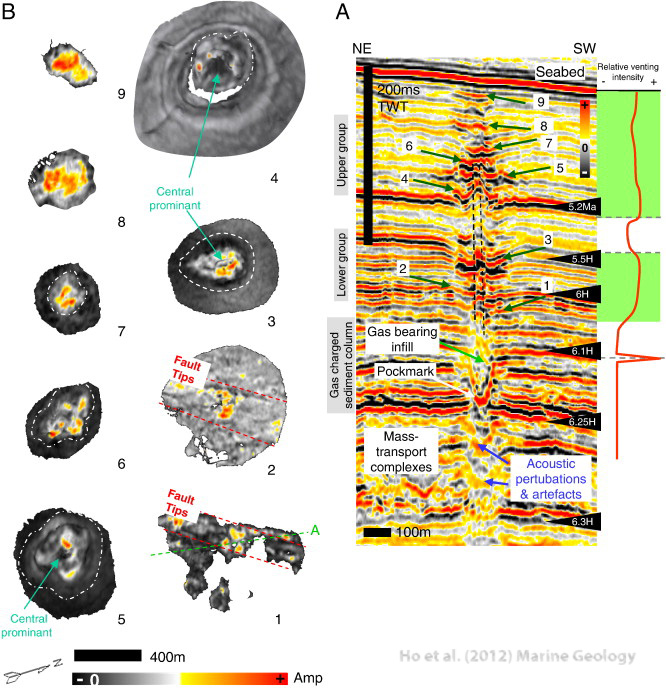
Fig. 4.
Vertical succession of sub-circular PHAAs. (A) Cross-section through a “column” of amplitude anomalies, including PHAAs of various morphologies (e.g. reflection 8 & 9, sub-horizontal; reflection 4, mounded; reflection 3, pockmark-like). Its location is depicted on horizon 1 in (B) by a green dotted line A. Note also the pockmark at the base (near 6.25 H). The succession is subdivided by a low-reflectivity interval between 5.5 H and 5.2 H. (B) 3-D rendering of individual amplitude anomalies within the column (numbered in (A)). These high amplitude reflections show: sub-circular depressions associated with PHAAs (horizon 3, 5 to 9); the base of the high amplitude sequence (horizon 1 & 2) is affected by a linear fault, along which PHAAs occur. The stacked, sub-circular depressions (horizon 3 to 5) host sub-circular PHAAs with a central prominent relief, which corresponds to the interpreted vertical zone that is deformed by faults or fractures (represented in dash on (A)) in the central of the vertical succession; a mounded PHAA is likely crossed by the interpreted vertical deformed zone (horizon 4).
The size and diameter of sub-circular PHAAs vary from a few tens of meters up to 100 m, and are often limited within the area of sub-circular depressions, whose diameter ranges from 100 to 200 m, with depth of concave relief ranging from 5 to 10 m. These sub-circular depressions are expressed by gently curved/concave upwards reflections, which are offset slightly from the laterally correlative reflections (e.g. reflection 3, 4; Fig. 4A). Polarity reversals were observed in some cases within the high amplitude succession.
This high amplitude series is divided vertically into an upper and lower group (Fig. 4A). The diameter of sub-circular PHAAs within the lower group increases upward, while those in the upper group decrease upward (reflection 4–7, Fig. 4B), then increase again close to the seabed (reflection 8–9, Fig. 4B). In addition, the PHAA associated depressions mirror these size changes.
The two groups of amplitude anomalies are separated by a low amplitude interval where reflections become disorganised (between horizons 5.5 and 5.2). The upper group occurs within the gas hydrate stability zone (GHSZ), as identified by a discontinuous bottom simulating reflector (BSR). The high amplitude reflections within the lower group appear to sag downward around the central axis, and exhibit raised flanks. This central axis corresponds to a narrow vertical, faulted zone which exhibits minor reverse faulting. It appears in 3-D view as central uplift inside depressions (e.g. reflection 3 & 5; Fig. 4B), and goes up through a mounded PHAA at horizon 5.2 Ma (reflection 4; Fig. 4A & B).
The central prominent part located in the bottom of the lower group (reflection 5 & 6; Fig. 4A) shows continuous, linear positive relief in planform (horizon 5 & 6; Fig. 4B) and is linearly aligned with the main fault beneath. The first PHAAs that appear at bottom of this group are small sub-circular PHAAs that align along the linear positive reliefs (horizon 5 & 6; Fig. 4B) and are not limited by depressions.
4.2.2. Definition and description of linear PHAAs
Linear PHAAs are characterized by their long but narrow shape on amplitude maps with aspect ratios of more 5, and ranges from ten(s) to hundred(s) of meters in length with widths less than 50 m. Linear PHAAs are associated with furrow-like shallow negative relief up to 2 m deep. These reflections are often horizontally discontinuous with their laterally correlative reflections (Fig. 5A), and with minor disruption of continuity beneath. All linear PHAAs are associated with chimney structures that are invariably affected by pull-up effects in this seismic survey.
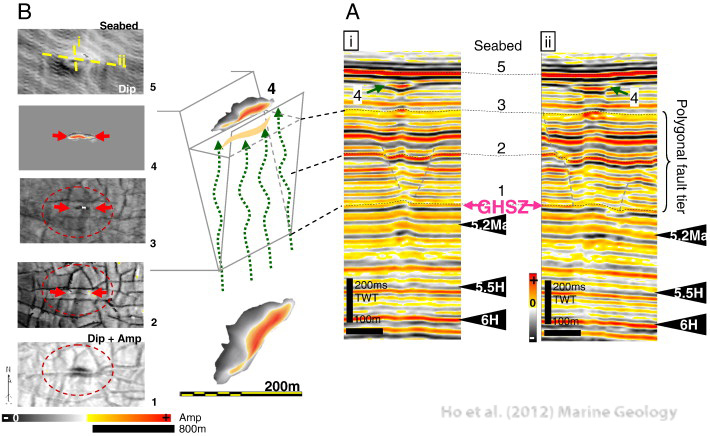
Fig. 5.
Seismic profiles and amplitude maps of numbered horizons showing a single linear conduit originating from the lower tip of a graben in the polygonal fault tier. (A) Profiles i and ii are arbitrary lines across and along the axis of the linear anomaly, respectively, and are located in (B) with yellow dashed line. The shallow v-shaped and curved reflections 4 correspond to a linear PHAA on horizon 4 in B. (B) Horizons of positive reflections that cross the pipe within the polygonal faulting interval (numbered on A): Horizon 1 shows the pull up zone corresponding to the linear lower amplitude area on the base of the polygonal fault tier. Horizon 2 shows that the linear shape is consistent up to (horizon 3) the top of the fault tier; Horizon 4 shows the linear conduit terminates upward into a high amplitude v-shaped reflection with a linear planform. Horizon 5 shows sub-circular furrows at the present day seabed, above the pipes and at the same location (the undulating lines running WNW–ESE are processing artifacts).
Two types of linear PHAAs are observed lying above isolate linear conduits or clustered linear conduits: individual and composite. They occur within well-bedded sediments that overly the polygonal fault tier, immediately below the seabed (reflection 3; Fig. 5A). They have the same orientation as the polygonal faults below, and are often associated with elliptical depressions at the seabed. These elliptical depressions have maximum diameters ranging from 200 to 300 m.
(1)The Individual linear PHAAs (Horizon 4; Fig. 5B) are expressed by a single high amplitude reflection with shallow negative relief on seismic sections (reflections 4; Fig. 5A). Their length ranges from 100 to 350 m. Individual linear PHAAs have the same trends as polygonal faults below, and frequently have similar orientations to tectonic faults to which they are often linked.
(2)The composite linear PHAAs, are the second type of linear PHAAs, and are found as positive high amplitude vertically stacked reflections. They are characterized by several individual linear patterns that link or group together. They are associated with linear conduits beneath that are adjacent to each other (Fig. 6A). The composite linear PHAAs have the same character as the individual linear PHAAs but are geometrically more complex. In plan view their length varies greatly between a few tens to several hundreds of meters.
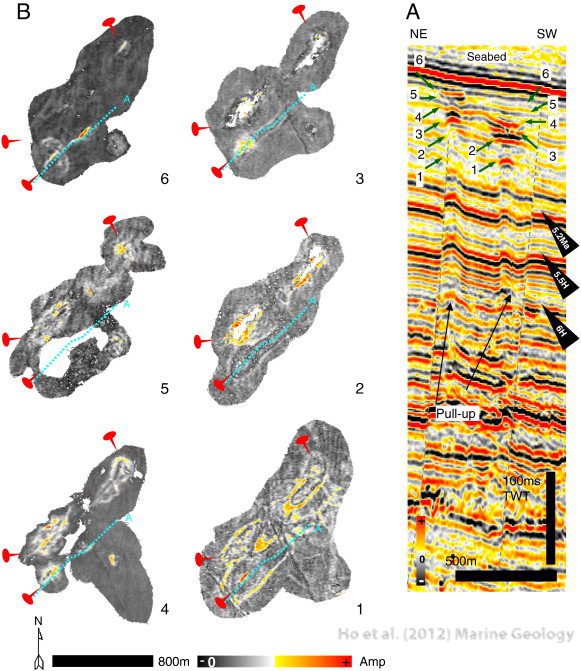
Fig. 6.
Composite linear PHAAs on profile and amplitude maps. (A) linear PHAAs link together above two linear acoustic pipes due to their proximity. Its location is depicted on horizons in (B) by blue dotted lines A. (B) Horizons that cross the high amplitude reflector above the acoustic pipes, show linear PHAAs (reference points are red tacks): Horizon 1 shows the high amplitude elongate-ring shapes surround the central seep points of linear conduits. Horizons 2, 3, 5 show the disrupted reflections with elongated gaps, and horizon 4 & 6 above which composite linear PHAAs occur with shallow/or no negative relief.
Fig. 6B shows in plan view that the shapes and lengths of these linear PHAAs vary within the vertical succession. The lowest PHAAs exhibit elongate ring shapes and progressively change upwards into composite linear PHAAs (horizons 4 & 6; Fig. 6B). Discontinuous areas are observed below the linear PHAAs in certain locations (horizon 2, 3, 5; Fig. 6B), and are represented by disrupted reflections in seismic sections.
4.3. Fluid venting structures with associated PHAAs
4.3.1. Linear conduits in seismic
Linear conduits are interpreted as being represented by linear low amplitude zones (dimming) that contrast strongly with the positive background amplitude of the horizons (e.g. horizon 1; Fig. 5B). The low amplitude zones in plan view have lengths (a hundred to several hundred meters) larger than their widths (less than 50 m). They usually have the same sizes and orientations as the associated PHAAs at their top.
In this survey, the seismic disturbance columns narrow upward (depth ~ 350 ms TWT), and inside these zones internal reflections are affected by pull-up effects (5–10 ms TWT). Polarity reversals are observed at the top of disturbance zones in some cases. Linear conduits are interpreted within the polygonal fault tier (Figs. 5A; 6A), and terminate into positive high amplitude reflections/packages at the top of the polygonal fault tier. Elongated shallow pockmarks were frequently observed at the present day seabed where they are seen to lie directly above linear PHAAs and pipes (horizon 5; Fig. 5B). The deeper limits of the linear conduits are apparently rooted into debris flows of marker horizon 6 H or in tectonic fault zones.
Horizons 1 to 4 in Fig. 5B illustrate that the disturbed columns intersect with the bottom of polygonal faults and go up through the central axis of grabens within the polygonal fault network.
4.3.2. Vertical succession of the two types of PHAAs
Linear PHAAs have been observed to be succeeded vertically by a circular PHAA under the base of an “Advancing” pockmark (Ho et al., 2012). They are expressed by several high amplitude reflections within a turbiditic unit (Fig. 7A). The oldest PHAA is labelled as reflection 1 (horizon 1; Fig. 7B), shows a linear PHAA (diameter ~ 200 m) in plan view, and is overlain by a longer linear PHAA (diameter 300 m) at reflection 2 (Fig. 7B). The dish-like high amplitude reflection (label 3) cuts through the surface of the turbidite deposit, and has a diameter of 400 m. It appears as a sub-circular PHAA in plan view (horizon 3; Fig. 7B), and is directly overlain by a pockmark. This vertical succession is suggestive of an evolutionary signature of the high amplitude anomalies in which PHAAs size increasing with time and vertically in space, up to the base of this pockmark.
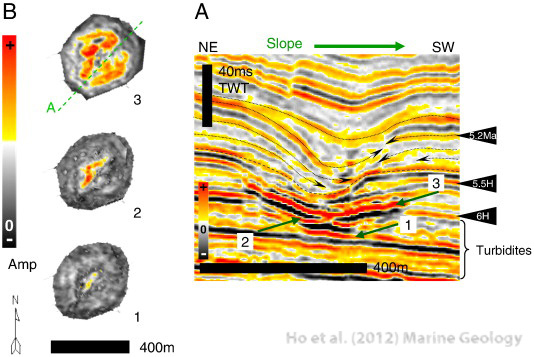
Fig. 7.
Stacked up PHAAs below an advancing pockmark, and above the turbidite surface. (A) Seismic profile. Its location is showed on horizon 3 in (B) by a green dotted line A. (B) Horizons 1 & 2 (numbered on A) of the high amplitude reflections show a smaller linear PHAA with two segments. These linear PHAAs are stacked below a sub-circular PHAA on horizon 3, which is limited inside a sub-circular depression.
4.3.3. Interpretation of ‘Polyphased pockmarks’ and their associated PHAA
Vertically stacked elliptical PHAAs with complex internal structures were observed either at the base of or surrounding the lower part of pockmarks. These pockmarks are characterized by dome-shaped reflections (3B, Fig. 8A) below the craters. Their sidewalls are defined by the terminations of truncated reflections in seismic sections (Fig. 8A). The pockmark sidewalls are partly covered by a downward-bending reflection in the northwest (reflection 6; Fig. 8A, left), which is the uppermost reflection of the v-shaped crater. The downward bending reflection is disrupted in SE but can be followed continuously from the NW far field into the pockmark. This type of pockmarks exhibits different sizes and forms of circular amplitude dim zones on horizons which stack vertically (3D horizon 4 to 6; Fig. 8B). The immediate sedimentary infill of the pockmarks consists of two reflections which sag asymmetrically downward (e.g. reflection 7, 8; Fig. 8A, left), whereas the lowest reflection 7 is disrupted at the inflexion point. These reflection configurations suggest that the pockmarks have gone through different stages of evolution, therefore they are called “Polyphased pockmarks”.
Vertically stacked elliptical PHAAs with complex internal structures were observed either at the base of or surrounding the lower part of pockmarks. These pockmarks are characterized by dome-shaped reflections (3B, Fig. 8A) below the craters. Their sidewalls are defined by the terminations of truncated reflections in seismic sections (Fig. 8A). The pockmark sidewalls are partly covered by a downward-bending reflection in the northwest (reflection 6; Fig. 8A, left), which is the uppermost reflection of the v-shaped crater. The downward bending reflection is disrupted in SE but can be followed continuously from the NW far field into the pockmark. This type of pockmarks exhibits different sizes and forms of circular amplitude dim zones on horizons which stack vertically (3D horizon 4 to 6; Fig. 8B). The immediate sedimentary infill of the pockmarks consists of two reflections which sag asymmetrically downward (e.g. reflection 7, 8; Fig. 8A, left), whereas the lowest reflection 7 is disrupted at the inflexion point. These reflection configurations suggest that the pockmarks have gone through different stages of evolution, therefore they are called “Polyphased pockmarks”.
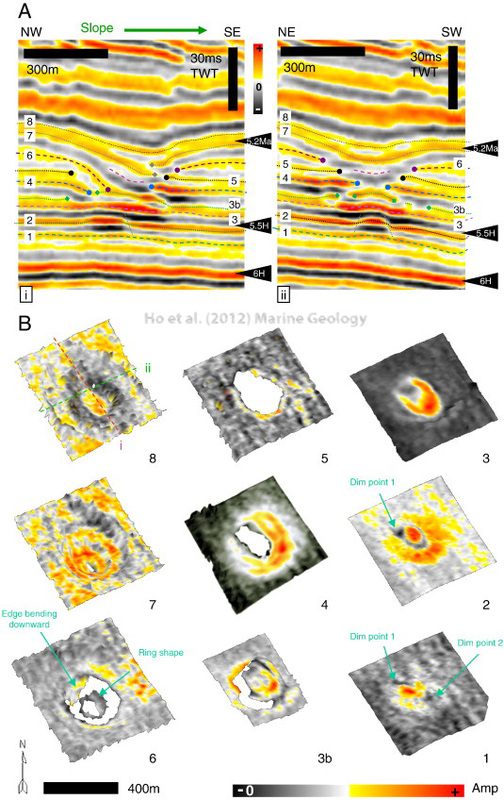
Fig. 8.
A polyphased pockmark. (A) Profiles i and ii are arbitrary lines across and along the pockmark axis. Note that the incomplete dome-shape in profile i, at reflection 3B is still linked partly with is original reflection, but disconnected on profile ii. (B) Amplitude maps of the numbered horizons. Horizon 1 shows an elliptical PHAA which is delimited by two small amplitude dim points in both ends; Horizon 2 shows an elliptical PHAA surrounded by a horseshoe-shaped PHAA; Note that the seep point 1 is still observed with a small dim zone. Horizon 3 shows a hoof-shaped PHAA above the edge of underlying elliptical PHAAs; Horizon 3B shows a dome structure at the pockmark base, with a long gap along its edge from N to W. Horizon 4 shows a crescentic shaped PHAA above the edge of the dome structure and a surrounding sub-elliptical truncation zone. Horizon 5 shows an asymmetric circular dim zone. Horizon 6 shows an ‘almost circular’ dim zone. Note the lower amplitude ring shaped feature in the middle of the crater. Horizon 7 shows the sediment cover subsiding asymmetrically above the first seep point location, with a small dim zone in the center. Horizon 8 shows the sediment subsiding asymmetrically.
Polyphased pockmarks occur within clay-dominated intervals, in the stratigraphic interval between 5.5 Ma and 5.2 Ma, i.e. between the two polygonal fault tiers. Their circular shapes in plan view measure approximately 150 m to 200 m, and the measured relief on seismic sections is less than 50 ms TWT.
4.3.3.1. Internal structures associated with PHAAs in 3-D views
The lowest elliptical PHAA with NW–SE orientation on horizon 1 and below the polyphased pockmark represented in Fig. 8 is associated with two small lower amplitude depressions at its two ends (horizon 1; Fig. 8B).
A bigger elliptical PHAA on horizon 2 is located in the northwest of this region where a small depression is observed (at dim point 1), and is surrounded by a ‘horseshoe’ shaped PHAA (horizon 2; Fig. 8B). Above the same location on horizon 3, a ‘hoof’ shaped PHAA (horizon 3; Fig. 8B) with the same orientation is observed. A structure comprising a dome is found at reflection 3b (Fig. 8A). Similar features characterize the base of all polyphased pockmarks in this survey. This dome is associated with a crescentic-shaped PHAA in the SE (horizon 3B; Fig. 8B). A long gap is found along the NW side of the dome feature and corresponds to the disruptions of reflection 3B (Fig. 8A). An elongated discontinuous zone and an asymmetric circular discontinuous zone oriented NW–SE are observed on horizons 4 and 5 (Fig. 8B). They cross the middle of pockmark and are located above the dome feature. A crescentic-shaped PHAA surrounds the elongated dim zone on horizon 4. The asymmetric dim zone on horizon 5 is larger along the SE side. Reflection 6 (Fig. 8A) crosses the topmost part of the v-shaped crater and continues laterally into the pockmark in the NW, appearing as a circular dim zone with extended edge depressions in NW in 3-D view (horizon 6; Fig. 8B. The sediments (reflection 7, 8) which cover the v-shaped crater and sagged downward, show the asymmetrical depression centers in three dimensional view (horizon 7 & 8; Fig. 8B). The disruption at the inflexion point of reflection 7, corresponds to a small circular dim zone in the depression (horizon 7; Fig. 8B).
5. Discussion
No direct lithological calibration of PHAAs is available in this shallow section. PHAAs were not sampled in the area, none of the available wells were penetrated the PHAAs. As a result, their interpretation has to rely on their acoustic expression, their geometry, and on indirect evidence from regional constraints on sedimentation in the area, from comparison with interpretation analogues of pockmarks at the seafloor in the study area and elsewhere.
5.1. Relationship between methane flux and positive amplitudes variations
Positive high amplitudes correspond to a downward increase of acoustic impedance, and could indicate (1) a single ‘hard’ layer, or (2) a (set of) thin hard layer beneath seismic resolution (Widess, 1973).
In the context of the Neogene of this study area, lithologies that could account for the patches of high acoustic impedance within the high continuity seismic facies (clay rich hemipelagites with soft impedance), are most likely to be hard carbonates or carbonate-cemented layers because of their high interval velocity (Hanneman et al., 1994 and Westbrook et al., 2008) and resultant localized velocity pull-up effects (Woods, 1991).
Gas hydrates (hosting sediment) are another high impedance material which could explain the high positive amplitudes, because they have high interval velocity compared to claystones (Westbrook et al., 2008) and are observed to generate pull-up effects (Hustoft et al., 2007). However they can only be present in the GHSZ. Only a small number of reliably interpreted occurrences of hydrates were observed in this area (250–275 mbsf, at the lower polygonal fault boundary of HD4).
The possibility that the PHAAs result from sand injection or silica diagenesis was also considered. Sand intrusions can exhibit a variety of geometries, but none of the published examples of sandstone intrusions exhibit the three-dimensional geometry shown here for the PHAAs (see reviews in Hurst and Cartwright, 2007). Many circular or sub-circular sandstone intrusions have a conical geometry with distinctive, discordant margins dipping about 15° to 25°. In marked contrast, PHAAs are flat-lying to gently mounded.
Silica diagenetic transformation from opal A-CT and opal CT-quartz occurs in formations rich in depositional amorphous silica (Kastner et al., 1977). The transformations result in increases in acoustic impedance, and a strong positive reflection at the phase boundary (e.g. Davies and Cartwright, 2002), commonly extending over many thousands of square kilometers. Localized anomalies due to silica diagenesis have been reported from northern Norway (Ireland et al., 2011) in association with a regionally extensive opal-A to CT phase boundary reflection. However, these have a contrasting three-dimensional geometry to the PHAAs as described here, and furthermore, there is no evidence in the study area of a regional phase boundary reflection. Although ODP boreholes drilled in this region have documented that the interval contains siliceous sediments (Wefer et al., 1998), reports state that their concentration never reaches very high values (Wefer et al., 1998). Therefore, we suggest this would not result in a major diagenetic transformation zone, so that is visible in seismic data, and any seismic anomalies in this interval must have another origin. Thus, we think it highly unlikely that PHAAs are related to silica diagenesis.
The systematic restricted distribution of PHAAs below paleo-pockmarks suggests a genetic relationship between the PHAAs and the pockmarks, and points to an interpretation of a fluid-related origin (i.e. methanogenic) for PHAAs. The geometry of the amplitude anomalies does not resemble any known depositional carbonate sedimentary features at this scale. Velocity pull-ups are most frequently observed beneath isolated PHAA: this phenomenon occurs especially within the GHSZ. In contrast, the vertically stacked PHAAs at the base of paleo pockmarks below the BSR, are not associated with any velocity pull up. This suggests that the single PHAA occurring above a BSR may well be associated with gas hydrates.
5.1.1. Methanogenic carbonates in Offshore Congo–Angola
According to previous studies of this basin (e.g. Gay, 2002, Charlou et al., 2004, Olu-Le Roy et al., 2007 and Pierre and Fouquet, 2007), the documented methane-related carbonates include principally four main types of carbonates: authigenic carbonate pavements, cemented clastic rocks or nodules, and cold seep carbonate communities (e.g. Hovland and Judd, 1988). Therefore we use the term methanogenic carbonates to describe all of these methane-related carbonates.
Methanogenic carbonates without seismic calibration are reported in a drill location in this survey, and are found in clay rich facies (hemipelagite or muddy turbidite deposits). They have a low isotopic δ13C value (− 34.4‰; Vignau et al., 2000) which is suggestive of methane as a carbon source (Hovland et al., 1985). The measured δ18O value (3.9‰) indicates that the temperature at which the carbonate formed was 5–10 °C and implies that these carbonates would have precipitated very early and close to the sediment-water column interface (Vignau et al., 2000).
Cold seep communities and gas hydrates with methane-rich plumes are associated with active pockmarks on the Congo–Angola margin (Gay, 2002, Charlou et al., 2004, Olu-Le Roy et al., 2007 and Pierre and Fouquet, 2007). Floating gas hydrates from the interface between massive carbonate crusts and reduced sediments were also observed by remote-operated vehicle inside a giant pockmark in the same region (Charlou et al., 2004).
Methanogenic carbonates form at, or close to the seabed through the production of cold seep communities or/and Anaerobic Methane Oxidation (Hovland et al., 1987 and Judd and Hovland, 2007). This oxidation can only be completed within the first tens of meters of burial within the sulfate-methane transition zone (SMTZ) (e.g. Borowski et al., 1996 and Snyder et al., 2007), which is 10–50 mbsf depth at present in this region (Wefer et al., 1998). Below the seafloor, methanogenic carbonates result from anaerobic oxidation of methane (AOM; Hovland et al., 1987), while at the seabed they result from the development of chemosynthetic communities ( Bayon et al., 2007).
Therefore, we suggest that the horizons at which methanogenic carbonates are inferred to occur, represent a shallow burial diagenetic ‘datum’ near the paleo-seabed or paleo water-sediment interface.
5.1.2. Timing of venting at the paleo-seabed
We propose that the timing of methane flow at the paleo-seabed can be approximated by the stratigraphic age of the horizons in which PHAAs occur when they are associated with pockmarks or depressions. The interpreted carbonates are associated with topographic depressions that can only be produced by moderate to fast methane flux, and one that would be able to elevate the base of SMTZ to within a few meters of the seabed ( Hovland et al., 1987). Accumulation of chemosynthetic carbonate faunas occurs within the seep depression at the seabed ( Hovland et al., 1987). The coincidence of a depression and a PHAA argues strongly that the SMTZ was very close to the seafloor, well within the resolution of the available seismic. The approximate timing of methane flow at the seabed would in this case be indicated by the stratigraphic position of methanogenic carbonates (PHAAs).
The duration of flow is suggested here to be reflected in the thickness of methanogenic carbonate (PHAAs), which cannot be assessed in detail without direct borehole calibration. PHAAs that are not associated with pockmarks/depressions, are suggested to have formed deeper below the seabed at different levels within the SMTZ (Regnier et al., 2011).
We distinguish fossil methanogenic carbonates from the actively forming systems, based on the fact that the fossil ones are buried by continued deposition and are thus moved below the SMTZ. Therefore, methanogenic carbonates (expressed by PHAAs here) that are found beyond the sulfate reduction zone, are interpreted as fossil seeps (cf. Paull et al., 1995).
5.1.3. Genetic model
The framework that we adopt here to interpret the significance of PHAAs within different types of venting sites is based on a model proposed by Roberts (2001) and Roberts et al. (2006). This model states that the variation in quantity and in morphology of authigenic and chemoherm carbonates (or PHAAs in our interpretation) is related to the dynamics of methane seepage. The model is in good agreement with measurements of measured methane fluxes and with the types of associated methane-derived formations at different venting sites reported by other authors (e.g. Torres et al., 2002, Gay et al., 2006 and Naudts et al., 2010).
Roberts (2001) and Roberts et al. (2006) proposed the following classification:
•Slow methane flux is principally characterized by chimneys (Roberts, 2001 and Cartwright et al., 2007), as well as carbonate cemented hardgrounds or mounds (Roberts, 2001), and bacterial mats with near total absence of macrofauna (Roberts, 2001 and Naudts et al., 2010);
•Moderate flux is expressed by small fluid expulsion features (Roberts, 2001 and Roberts et al., 2006), which could be a pipe with a crater above (Løseth et al., 2001, Cartwright et al., 2007 and Moss and Cartwright, 2010a), isolated authigenic carbonates pavements, gas hydrate mounds and dense chemosynthetic communities (Roberts, 2001, Torres et al., 2002 and Naudts et al., 2010);
•High flux is associated with conical structures (pockmarks) which are considered as the result of dramatic and strong fluid releases (Pantin, 1980, Hovland, 1981, Roberts et al., 2006 and Cartwright et al., 2007), and absence of chemosythesic carbonates (Roberts, 2001 and Gay et al., 2007).
This model is used to interpret the various types of venting structures observed in this study.
5.2. Methane fluxes and their subsurface expression
5.2.1. Relationship between sub-circular PHAAs and pockmarks
Sub-circular PHAAs associated with a series of vertically stacked shallow depressions (Fig. 4A) are interpreted to be the result of moderate methane flux, since the formation of methanogenic carbonate is not favored at a rapid seep site (Roberts et al., 2006 and Naudts et al., 2010). Although the sub-circular, concave depressions exhibit a degree of fluid venting dynamics, the overlying configuration suggests that the flux is modest enough to inhibit crater development but dynamic enough to create shallow, seafloor depressions. These depressions created by fluid expulsions can nonetheless be regarded as pockmarks (Judd and Hovland, 2007).
The shallow pockmarks (e.g. reflection 3, 5; Fig. 4A & B) have prominent centers and we interpret these as cylindrical zones of fracturing (black dot lines in Fig. 4A), which most likely acted as conduits to feed the youngest pockmarks. This central zone or conduit is interpreted to grow from a sub-vertical fault below, which was masked by the seismic distortions. The upper tip of this fault is visible in deeper amplitude maps (reflection 1 & 2; Fig. 4A & B).
We interpret the formation of this high amplitude succession as due to gas leaking from the reservoirs below horizon 6.25 H (H: Horizon with interpolated age but no age calibration), and the gas expulsion at the paleo-seabed (6.1 H) is expressed by the gas-charged infilled pockmark (Fig. 4A). The lower amplitude interval above with low continuous reflections suggested fluid flow decreased between 6 H to 6.1 H (Fig. 4A). The widths of PHAAs progressively increase upwards (Fig. 4) indicating that fluid flow was progressively reactivated at horizon 6 H. The occurrence of horizontal deposits between horizon 5.5 H and 5.2 Ma suggests that fluid venting stopped during this period. The mound shaped carbonate (PHAA) at 5.2 Ma indicates that seepage restarted at the paleo-seafloor with a relatively moderate flux rate. The PHAAs associated with pockmarks which occurred later decrease in size upwards (reflection 8, 9; Fig. 4A), suggesting that the fluid expulsions decreased gradually and the methane flux slowed down progressively (Fig. 4A).
The PHAAs associated with pockmarks become bigger and flatter at 50 ms TWT below the seabed, which likely indicates that the fluid flow increased but remained in a relatively moderate state of flux, because of the observed flat morphologies and the absence of craters. Finally, this high amplitude series terminated upward into a gently dipping pockmark at the current seabed, implying the seep site is still active.
5.2.2. Linear conduits and PHAA without pockmark
Acoustic pipes or columnar seismic disturbance zones are widely recognized as gas conduits (Heggland, 1997, Løseth et al., 2001, Bünz et al., 2003, Hustoft et al., 2007 and Moss and Cartwright, 2010a). Linear conduits associated with linear PHAAs are quite different from the sub-circular PHAAs sequence, as no obvious pockmarks or expulsion craters were observed within the vertical succession. So the linear conduits are interpreted as a type of slow fluid venting feature, the so-called ‘seepage-pipe’ (Cartwright et al., 2007).
The upwards bending of reflections commonly observed in pipes are believed in some cases to represent the deformation of sedimentary strata due to vertical fluid movement or episodic blow out events (Bouriak et al., 2000, Løseth et al., 2001, Berndt et al., 2003, Gay et al., 2007 and Hustoft et al., 2007). An alternative interpretation is that these upward bending zones are velocity pull-up anomalies due to the presence of high velocity material within the pipe above (Ecker et al., 1998, Holbrook et al., 2002, Hustoft et al., 2007, Chand et al., 2009 and Hustoft et al., 2010). This material could be carbonates (Hustoft et al., 2007 and Westbrook et al., 2008) or gas hydrates within or directly above the pipes (Ecker et al., 1998 and Hustoft et al., 2007). The recent work of Løseth et al. (2011) demonstrated that the ‘local anticline’ or the pull-up structures within the pipes in the offshore Nigeria, are most likely geophysical artifacts related to imaging complexity. Løseth et al. (2011) also argued that hydraulic fractures should be present inside the seismically disturbed zone of the pipes.
The pipes identified in the study area most likely represent highly focused paleo-fluid-migration paths, and this inference is supported by the occurrence of linear PHAAs at the top of pipes above the polygonal fault tier. These are interpreted as methanogenic carbonates fed by the methane that migrated through linear conduits which were guided by polygonal faults beneath. The occurrences of pockmarks (shallow depression on horizon 1; Fig. 5B) at the current seabed indicate that the pipe conduits are still active, or were active very recently.
5.2.3. The origin of linear conduit geometries
The geometry of these linear conduits is interpreted to result from the deformational exploitation by the overpressured fluid of pre-existing fracture networks. The basal apex of polygonal fault graben is likely to be the first weak zone that the fluid encountered. The dim zones on the horizons that cross the seismic chimney (Fig. 5) are compatible with the propagation of linear fractures upward through the central axis of the graben from the base, since they have the same length and orientation as the polygonal fault planes (Figs. 3B; horizon 3 & 4; 5B).
Normal faulting in the polygonal fault system corresponds to an extensional regime, with σ1 (stress 1) vertical and σ2 and σ3 identical (σ2 = σ3 = σH) regionally, with local modifications around fault nucleation points. Along a given fault, σ3 is horizontal and perpendicular to the fault strike whereas σ2 aligns with the fault strike. If fluid pressure exceeds σ3, hydraulic fracture would occurs perpendicular to σ3, i.e. in the vertical plane following the axis of the graben defined by a point of conjugate faults in a polygon (Fig. 5).
Slow to moderate fluid flux was suggested to be transported by the linear conduit and allowed the development of linear accumulation of methanogenic carbonates above, as seen on the seismic data as linear PHAAs occurring above the polygonal fault tier (Fig. 5).
Concentrated fluid leakage at multiple fault locations, is suggested to allow the linear PHAAs to develop in clusters (Fig. 6), as the lateral terminations of linear PHAAs extended until they connected to each other.
The example shown in Fig. 7 demonstrates that linear PHAAs below pockmarks can grow upwards and evolve into sub-circular PHAAs, and then terminate upwards into a pockmark crater. Such a model of methanogenic carbonates occurring prior to the formation of eruption craters has previously been documented by Hovland et al. (1987). Our preferred interpretation of the vertical succession of PHAAs is that they represent an increase of flux over time, from slow to moderate flux, followed by the rupture of sediment by an overpressured fluid eruption that generated the initial pockmark crater (cf. some early examples, Worzel and Watkins, 1974, Sieck, 1975 and Hovland and Judd, 1988) (Hovland, 1982, Hovland, 1989, Judd and Hovland, 2007 and Cathles et al., 2010). Our interpretation is thus fully in agreement with the model proposed by Hovland et al. (1987) in which the formation of methanogenic carbonates is prior to the seal failure. Our examples presented here show how one type of PHAA can grade into another over time.
5.3. Conceptual model for the formation of ‘Polyphased pockmarks’
The internal structures of polyphased pockmarks suggest the fluid expulsion responsible for their genesis was episodic (cf. Hovland et al., 2005, Hovland and Svensen, 2006 and Andresen and Huuse, 2011). An evolutionary sequence for polyphased pockmarks in our study area is proposed in Fig. 9A, where the uppermost horizons represent the surfaces that occurred at or close to the paleo-seabed, and where methanogenic carbonates developed. The evolutionary stages in this model are as follows:
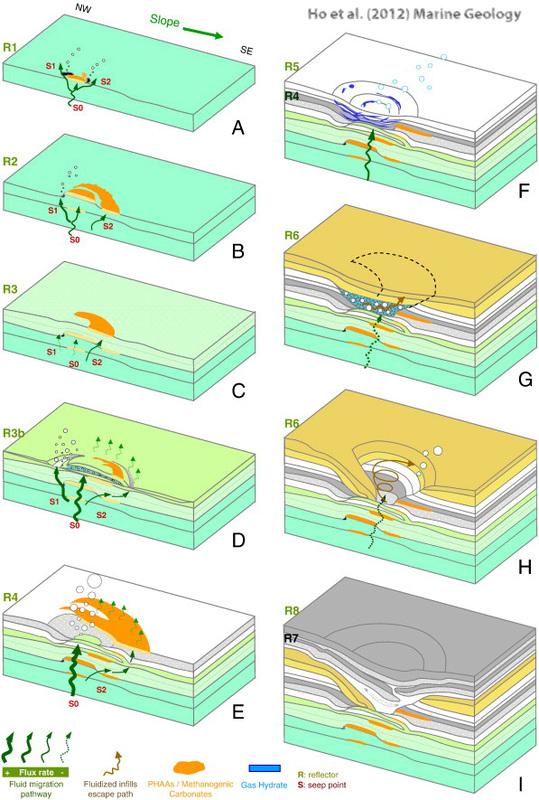
Fig. 9.
Theoretical model for step-wise genesis of polyphased pockmarks (see also Fig. 8A for the numbering scheme of reflections). (A) Slow methane seep is expressed by the small methanogenic carbonate patches at the site. Fluid escape then bypassed the central carbonate seal and created two seep points (1 and 2 in red). (B) The elliptical carbonate patch continued to develop at the central seep. Slow fluid flux at seep 2 bypassed the sealed locations, and fed the new carbonates surrounding the central patch. The small depression at seep point 1 suggests a relatively faster flux. (C) Low fluid flux at seep point 2 bypassed the carbonate patches of reflection 1 and 2 and escaped, to form a hoof-shaped PHAA/carbonate above the edge of previous carbonate. (D) A less permeable layer, an interpreted carbonate dome, was deposited and covered the seep site during the lower fluid flux period. Overpressure fluid inside the carbonate dome breached the NW internal edge of the dome. (E) Fast flux concentrated at seep point 0 where carbonate was unable to form. Fluid at seep 2 continued to by-pass the sealed location and migrated upward to form a crescentic PHAA (horizon 4; Fig. 8B) above the edge of the previous carbonate. (F) Sediment deposed above the seepage, during the fluid less active period. Slow methane flux is suggested to interact with the later sedimentation within GSHZ. Gas hydrates veins or layers were formed within the sediment layers, above the seep point and within an elliptical perimeter. (G) Horizontal deposits (before their deformation) at reflection 6 suggest a fluid inactive period. Gas hydrate dissociation is probably induced by sealevel fluctuations or erosional event, which is indicated by truncation surface (reflection 6; Fig. 8A). Overpressured, liquefied sediment below the reflection 6 escaped to surface by cutting a crescentic window (horizon 6; Fig. 8B). (H) Sediment cover collapsed. Vertical movement of liquefied sediment (brown arrow) left the trace as a dim ring in the center of crater (horizon 6; Fig. 8B). Notice that, the expulsive focus of this pockmark shifted from NW to SE, from above the gap of the dome to above the seep point 0. It is confirmed by the moderate-amplitude ring shape within the crater and above the seep point 0. (I) Later sedimentation sealed the whole crater as the fluid flux waned and died. It is suggested by the geometries of horizon 7 and 8.
(1) The occurrence of a near-elliptical PHAA on horizon 1 & 2 (Figs. 8B & 9B), below the pockmark (at seep point S0; Fig. 9A & B) and without eruptional crater, suggests that the seepage started with a slow flux. The small lower amplitude depressions (point 1 & 2) on horizon 1 & 2 (Fig. 8B), are interpreted as paleo-seepage points (as S1 & S2; Fig. 9A & B) left by small scale vents. (2) The occurrence of crescentic methanogenic carbonates (PHAA) surrounding the elliptic one (horizon 2; Fig. 8B) most likely results from fluid at seep point 2 bypassing the newly formed top seals (PHAA) and escaping via their outer boundary (horizon 2; Fig. 9B). Just above, methanogenic carbonates were fed and developed as open circular shapes. (3) The carbonates continued to develop above the seal breach at the edge of the previous carbonate zone, and moderate fluid escape from the only active seep point 2 formed a hoof-shaped PHAA (horizon 3; Figs. 8B & 9C). Levin (2005) observed a similar shape of cold seep carbonate with smaller size (1 m diameter) outcropped in the Monterey Bay bottom, and was called ‘seep-ring’.
The positive dome-shaped reflection (horizon 3b; Fig. 8A) shows a localized PHAA in plan view, and appears as a dome in 3D view (horizon 3b; Fig. 8B). It is interpreted as a dome-shaped carbonate pavement. Alternatively, this dome-shaped structure could be a less permeable layer which was domed upwards by the overpressured fluid beneath, and its sidewalls were sufficiently strong to maintain the structural form, possibly because it was preferentially cemented by carbonate deposits (Mazzini et al., 2008). Under the assumption that the pockmark was located at the paleo-seabed and within GHSZ, at the moment of its formation (the present day depth of GHSZ is 200 ms TWT, approximately 180 mbsf). It is possible that the material that accumulated inside the carbonate dome was gas hydrate by analogy with the case of a hydrate dome covered by pelagic sediment in the Gulf of Mexico (Fisher, 1997; in Penn State website http://www.science.psu.edu/news-and-events/1997-news/iceworms.htm).
The hydrate dissociated afterwards: this may have been caused by the pressure reduction at the paleo-seabed, and was probably due to contemporary sea level fluctuations. As a result, the overpressured fluid breached the lateral zone (along NW side) of the less permeable dome structure, and we observe a long fracture (horizon 3B; Fig. 8B). New sediments were deposited above the deformed dome-shape (Fig. 9E), whilst the seep point 1 became inactive and seep point 0 reactivated with a strong flux. This would explain the occurrence of carbonate developed above the edge of the dome and surrounding the strong venting point which formed a shallow elliptical crater (horizon 4; Figs. 8B & 9E). Then fluid flow declined to the point where sediment could drape the shallow crater beneath, and any subsequent flux may have led to hydrate formation within later sediment deposits once again (horizon 5; Fig. 9F).
The drape unit at reflection 6 is suggested to be deposited during the period of fluid deactivation (Fig. 9G). Hydrate dissociation under reflection 6 would induce liquefaction of host sediment (Riedel et al., 2006), during probably the events of contemporary sea level fluctuation. Sediments would be fluidized by the liberated methane becoming overpressured below the sedimentary cover (reflection 6), and created a circular carter on horizon 5 (Fig. 8). We suggest that liquefied sediment along with the gas would have escaped through the margins of the crater where the seal has been breached (Fig. 9H). Therefore, a crater was developed at the surface due to the volume loss in the underlying subsurface, and it is expressed by the bending downward reflection 6 on NW sidewall (Fig. 8A).
We caution that, the origin cause for the deformation of the sedimentary cover represented by reflection 6 could be modified or originate from bottom current effects. But the clear circular edge of the crater at reflection 6 (Fig. 8), suggests that it can only be created by the fluid expulsion rather than by the local current activity. Likewise, the collapsed feature within individual v-shaped craters has been observed in different locations of this survey, and it supports this model. Equally, fossil pockmarks associated with collapse features induced by subsurface material removal has been reported firstly by Imbert et al. (2008), who interpreted their origin to be related to hydrate dissociation. Actual lenticular gas hydrate inside an active Nigerian pockmark was detected by an Autonomous Underwater Vehicle (AUV) seismic survey (Tony-George and Cauquil, 2007). The model of collapse within a pockmark, has been tested on the same Nigerian pockmark through numerical modelling by Sultan et al. (2010), and supports the explanation of hydrate dissociation. In our study area, it is plausible that hydrate dissociation could have led to collapsed pockmark formation, since there is clear evidence for the position of the GHSZ at the present day.
Finally, the vertical movements of fluidized sediment inside the depression continued intermittently until final termination of the venting site (Fig. 9I).
Moreover, all polyphased pockmarks are sealed at 5.2 Ma, at the End Miocene/Early Pliocene and it is interesting that this coincides with a eustatic sea level rise (Haq et al., 1987). It is suggested that this may have stabilized the subsurface fluid pressure regime and deactivated the fluid venting episode.
6. Conclusion
A conceptual model of a combination of vertical succession for fluid venting structures summarizes our hypothesis (Fig. 10). The uppermost horizons representing the surface close to or at the paleo-seabed, are viewed here as the positions where methanogenic carbonates resulted from AOM or activity of chemosynthesis communities. Because of the vertical seismic resolution limits of this survey, and the close vertical separation between the PHAAs at the seabed and below, we interpret these to be expressed by a single reflection. The genetic relationship between all these fluid venting features is found through the geometric and morphologic analyses on seismic, coupled with the interpretation of amplitude variations. Our conclusions for this study are:
1.The order of occurrence for methanogenic carbonates, pockmarks or chimney structures within vertical successions, is dependent on the fluid flux of episodic vents.
2.PHAAs are always associated with fluid flow structures, e.g. pockmarks, chimney structures.
3.PHAAs occur within GHZS are often associated with seismic structures that affected by pull-up effects.
4.PHAAs correspond to high impedance and material with high interval velocity.
5.PHAAs are isolated and very localized features. They have two main forms, circular and linear, and are associated with shallow, linear or circular depressions (2 m depth).
6.PHAAs are sited above tectonic faults and this implies that gas migrated from deeper sources.
7.Linear PHAAs follow always trends of polygonal faults or regional faults underneath.
8.PHAAs are interpreted here as methanogenic carbonates and/or gas hydrate in an acoustically soft host lithology (hemipelagites).
9.Methanogenic carbonates formed either at the seabed by chemosynthesis communities, or in the very shallow seabed by AOM, at the first tens meters below the seafloor in the SMTZ.
10.PHAAs indicate the location of where methane was released at the paleo-seabed or within the shallow subsurface as methanogenic carbonates (PHAAs) form within the SMTZ which is close to or at the sea bed.
11.The dynamics of fluid expulsion is expressed by the venting structures and by the geometries of associated PHAAs.
12.Linear PHAAs with associated linear shallow depressions are interpreted as slow seep.
13.Sub-circular PHAAs with associated sub-circular depressions are interpreted as moderate seep.
14.Sub-circular PHAAs within shallow depressions are potentially the stage before proceeding into pockmarks, during an overall increases of seepage rate.
15.PHAAs which terminate into pockmarks and craters, suggest the increase of methane flux over time and changes from moderate to a fast venting model (Fig. 7).
16.Vertical successions of PHAAs recorded the local fluid leakages, by studying these successions, histories of fluid migration in basins can be reconstructed.

Fig. 10.
A hypothetical combined vertical succession for the evolution of different venting structures, depending on the dynamics of venting. (A) Slow seeps at fault locations are characterized by linear PHAAs (interpreted carbonates). (B) Slow to moderate seeps are characterized by sub-circular PHAAs. (C1) Moderated seeps often generate sub-circular like depressions with gently dipping base. (C2) Fast seeps are represented by circular crater or characterized by absences of PHAAs. (D) Constant but less active fluids interact with later sedimentation to form hydrate within sediment layers in GHSZ. Finally, (E) gas hydrate dissociations induce sediment liquefactions and (F) expulsion to create collapsed depressions.
Key words: Sutieng Ho, pockmark, Sutieng Ho, gas chimney, seismic ,Sutieng Ho polygonal fault Sutieng Ho methane authigenic carbonate Sutieng Ho Lower Congo Basin Angola
Acknowledgments
We are grateful to Total S.A. for the technical support and for providing us with data set.
SH acknowledges support from Cardiff University research grant and Total S.A.'s financial support.
‘N’ anonymous reviewers are thanked for their critical commentaries.
Schlumberger are thanked for their donation of the GeoFrame interpretation software.
Special thanks for B. Paternoster for his geophysic knowledge sharing, and D. Carruthers for his guidance of scientific discussion.
References
Aiello, I.W., 2005. Fossil seep structures of the Monterey Bay region and tectonic/
structural controls on fl uid fl ow in an active transform margin. Palaeogeography,
Palaeoclimatology, Palaeoecology 227, 124–142.
Anderson, J.E., Cartwright, J., Drysdall, S.J., Vivian, N., 2000. Controls on turbidite sand de-
position during gravity-driven extension of a passive margin: examples from Mio-
cene sediments in Block 4, Angola. Marine and Petroleum Geology 17, 1165–1203.
Andresen, K.J., Huuse, M., 2011. ‘Bulls-eye’ pockmarks and polygonal faulting in the
Lower Congo Basin: relative timing and implications for fl uid expulsion during
shallow burial. Marine Geology 279, 111–127.
Andresen, K.J., Huuse, M., Clausen, O.R., 2008. Morphology and distribution of Oligo-
cene and Miocene pockmarks in the Danish North Sea — implications for bottom
current activity and fl uid migration. Basin Research 20, 445–466.
Andresen, K.J., Huuse, M., Schødt, N.H., Clausen, L., Seidler, L., 2011. Hydrocarbon
plumbing systems of salt mini-basins offshore Angola revealed by 3D seismic anal-
ysis. American Association of Petroleum Geologists Bulletin. AAPG Bulletin 95,
1039–1065.
Anka, Z., Séranne, M., 2004. Reconnaissance study of the ancient Zaire (Congo) deep-sea
fan. (ZaiAngo Project). Marine Geology 209, 223–244.
Anka, Z., Séranne, M., Lopez, M., Scheck-Wenderoth, M., Savoye, B., 2009. The long-term
evolution of the Congo deep-sea fan: a basin-wide view of the interaction between a
giant submarine fan and a mature passive margin (ZaiAngo project). Tectonophysics
470, 42–56.
Bayon, G., Pierre, C., Etoubleau, J., Voisset, M., Cauquil, E., Marsset, T., Sultan, N., Le Drezen,
E., Fouquet, Y., 2007. Sr/Ca and Mg/Ca ratios in Niger Delta sediments: implications
for authigenic carbonate genesis in cold seep environments. Marine Geology 241,
93–109.
Berggren, W.A., Kent, D.V., Swisher, C.C., Aubry, M.-P., 1995. A revised Cenozoic Geo-
chronology and Chronostratigraphy. In: Berggren, W.A., Kent, D.V., Aubry, M.-P.,
Hardenbol, J. (Eds.), Geochronology, Time Scales and Global Stratigraphic Correla-
tion: Special Publication 54: Tulsa, Society of Economic Paleontologists and Miner-
alogists, pp. 95–126.
Berndt, C., 2005. Focused fl uid fl ow in passive continental margins: Philosophical
Transactions of the Royal Society a-Mathematical Physical and Engineering Sci-
ences 363, 2855–2871.
Berndt, C., Bünz, S., Mienert, J., 2003. Polygonal Fault Systems on the Mid-Norwegian
Margin: a Long-term Source for Fluid Flow. In: Rensbergen, P.V., Hillis, R., Maltman,
A., Morley, C. (Eds.), Subsurface Sediment Mobilization. Geological Society Special
Publications, vol. 216. Geological Society of London, London, pp. 283–290.
Borowski, W.S., Paull, C.K., Ussler, W., 1996. Marine pore-water sulfate pro fi les indicate
in situ methane fl ux from underlying gas hydrate. Geology 24, 655–658.
Bouriak, S., Vanneste, M., Saoutkine, A., 2000. Inferred gas hydrates and clay diapirs
near the Storegga Slide on the southern edge of the Vøring Plateau, offshore Norway.
Marine Geology 163, 125–148.
Broucke, O., Temple, F., Rouby, D., Robin, C., Calassou, S., Nalpas, T., Guillocheau, F., 2004.
The role of deformation processes on the geometry of mud-dominated turbiditic sys-
tems, Oligocene and Lower-Middle Miocene of the Lower Congo basin (West African
Margin). Marine and Petroleum Geology 21, 327–348.
Bünz, S., Mienert, J., Berndt, C., 2003. Geological controls on the Storegga gas-hydrate
system of the mid-Norwegian continental margin. Earth and Planetary Science
Letters 209, 291–307.
Campbell, K.A., Bottjer, D.J., 1993. Fossil cold seeps. National Geographic Research and
Exploration 9, 326–343.
Cartwright, J.A., Dewhurst, D.N., 1998. Layer-bound compaction faults in fi ne-grained
sediments. Geological Society of America Bulletin 110, 1242–1257.
Cartwright, J., Huuse, M., Aplin, A., 2007. Seal bypass systems. AAPG Bulletin 91,
1141–1166.
Cathles, L.M., Su, Z., Chen, D., 2010. The physics of gas chimney and pockmark forma-
tion, with implications for assessment of sea fl oor hazards and gas sequestration.
Marine and Petroleum Geology 27, 82–91.
Cauquil, E., Stephane, L., George, R.A., Shyu, J.-P., 2003. High Resolution Autonomous
Underwater Vehicle (AUV) Geophysical Survey of a Large, Deep Water Pockmark,
Offshore Nigeria. EAGE 65 th Conference & Exhibition, Stavanger, Norway, June
2003.
Chand, S., Rise, L., Ottesen, D., Dolan, M.F.J., Bellec, V., Bøe, R., 2009. Pockmark-like de-
pressions near the Goliat hydrocarbon fi eld, Barents Sea: morphology and genesis.
Marine and Petroleum Geology 26, 1035–1042.
Charlou, J.L., Donval, J.P., Fouquet, Y., Ondreas, H., Knoery, J., Cochonat, P., Levaché, D.,
Poirier, Y., Jean-Baptiste, P., Fourré, E., Chazallon, B., 2004. Physical and chemical
characterization of gas hydrates and associated methane plumes in the Congo–
Angola Basin. Chemical Geology 205, 405–425.
Cramez, C., Jackson, M.P.A., 2000. Superposed deformation straddling the continental-
oceanic transition in deep-water Angola. Marine and Petroleum Geology 17,
1095–1109.
Davies, R.J., Cartwright, J.A., 2002. A fossilized opal A to opal C/T transformation on the
northeastAtlantic margin: support for a signi fi cantly elevated paleogeothermal
gradient during the Neogene? Basin Research 14, 467–486.
De Boever, E., Swennen, R., Dimitrov, L., 2006. Lower Eocene carbonate-cemented
“chimney” structures (Varna, Bulgaria) — control of seepage rates on their forma-
tion and stable isotopic signature. Journal of Geochemical Exploration 89, 78–82.
Droz, L., Rigaut, F., Cochonat, P., Tofani, R., 1996. Morphology and recent evolution of
the Zaire turbidite system (Gulf of Guinea). Geological Society of America Bulletin
108 (3), 253–269.
Duval, B., Cramez, C., Jackson, M.P.A., 1992. Raft tectonics in the Kwanza Basin, Angola.
Marine and Petroleum Geology 9, 389–404.
Ecker, C., Dvorkin, J., Nur, A., 1998. Sediments with gas hydrates: internal structure
from seismic AVO. Geophysics 63, 1659–1669.
Fisher, C., 1997. Penn State Science, 1997, Scientists Discover Methane Ice Worms
on Gulf of Mexico Sea Floor. Website: http://www.science.psu.edu/news-and-
events/1997-news/iceworms.htm.
Frerichs, W.E., Shive, P.N., 1971. Tectonic implications of variations in sea fl oor spread-
ing rates. Earth and Planetary Science Letters 12, 406–410.
Gay, A., 2002. Les marqueurs géologiques de la migration et de l'expulsion des fl uides
sédimentaires sur le plancher des marges passives matures : exemples dans le
bassin du Congo. PhD Thesis, University of Lille, France, 425 p.
Gay, A., Lopez, M., Cochonat, P., Sultan, N., Cauquil, E., Brigaud, F., 2003. Sinuous pock-
mark belt as indicator of a shallow buried turbiditic channel on the lower slope of
the Congo basin, West African margin. Geological Society, London, Special Publica-
tions 216, 173–189.
Gay, A., Lopez, M., Cochonat, P., Sermondadaz, G., 2004. Polygonal faults furrows sys-
tem related to early stages of compaction-Upper Miocene to Present sediments
of the Lower Congo Basin. Basin Research 16, 101–116.
Gay, A., Lopez, M., Cochonat, P., Séranne, M., Levaché, D., Sermondadaz, G., 2006. Isolat-
ed sea fl oor pockmarks linked to BSRs, fl uid chimneys, polygonal faults and stacked
Oligocene–Miocene turbiditic palaeochannels in the Lower Congo Basin. Marine
Geology 226, 25–40.
Gay, A., Lopez, M., Berndt, C., Séranne, M., 2007. Geological controls on focused fl uid
fl ow associated with sea fl oor seeps in the Lower Congo Basin. Marine Geology
244, 68–92.
Hanneman, D.L., Wideman, C.J., Halvorson, J.W., 1994. Calcic Paleosols; their use in sub-
surface stratigraphy. AAPG Bulletin 78, 1360–1371.
Haq, B.U., Hardenbol, J., Vail, P.R., 1987. Chronology of fl uctuating sea levels since the
Triassic. Science 235, 1156–1167.
Heggland, R., 1997. Detection of gas migration from a deep source by the use of explo-
ration 3D seismic data. Marine Geology 137, 41–47.
Heggland, R., 1998. Gas Seepage as an Indicator of Deeper Prospective Reservoirs. A
Study Based on Exploration 3D Seismic Data. Marine and Petroleum Geology, 15,
pp. 1–9.
Ho, S., Cartwright, J., Imbert, P., 2012. The Formation of Advancing Pockmarks Arrays:
an Interplay Between Hydrocarbon Leakage and Slope Sedimentation. AAPG Annu-
al Convention and Exhibition 2012. . Extended abstract.
Holbrook, W.S., Gorman, A.R., Hornbach, M., Hackwith, K.L., Nealon, J., Lizarralde, D.,
Pecher, I.A., 2002. Seismic detection of marine methane hydrate. The Leading
Edge 21, 686–689.
Hovland, M., 1981. A Classi fi cation of Pockmark Related Features in the Norwegian
Trench. Continental Shelf Institute (IKU), publication no. 106, p. 28.
Hovland, M., 1982. Pockmarks and the Recent geology of the central section of the
Norwegian Trench. Marine Geology 47, 283–301.
Hovland, 1985. Seabed Features Caused by Shallow Gas in North Sea. AAPG Bulletin 69
(Abstract).
Hovland, M., 1989. The formation of pockmarks and their potential in fl uence on offshore
construction. Quarterly Journal of Engineering Geology & Hydrogeology 22, 131–138.
Hovland, M., 2008. Deep-water Coral Reefs. Unique Biodiversity Hot-Spots. Praxis Pub-
lishing, UK, p. 278.
Hovland, M., Judd, A.G., 1988. Seabed pockmarks and seepages: impact on geology, bi-
ology, and the marine environment. Graham & Trotman, London. xii, p. 293 pp.
Hovland, M., Sommerville, J.H., 1985. Characteristics of two natural gas seepages in the
North Sea. Marine and Petroleum Geology 2, 319–326.
Hovland, M., Svensen, H., 2006. Submarine pingoes: indicators of shallow gas hydrates
in a pockmark at Nyegga, Norwegian Sea. Marine Geology 228, 15–23.
Hovland, M., Thomsen, E., 1989. Hydrocarbon-based communities in the North Sea?
Sarsia 74, 29–42.
Hovland, M., Judd, A.G., King, L.H., 1984. Characteristic features of pockmarks on the
North Sea Floor and Scotian Shelf. Sedimentology 31, 471–480.
Hovland, M., Talbot, M., Olaussen, S., Aasberg, L., 1985. Recently formed methane-
derived carbonates from the North Sea fl oor. In: Thomas, B.M. (Ed.), Petroleum
Geochemistry in Exploration of the Norwegian Shelf. Graham & Trotman, Norwegian
Petroleum Society, pp. 263–266.
Hovland, M., Talbot, M.R., Qvale, H., Olaussen, S., Aasberg, L., 1987. Methane-related
carbonate cements in pockmarks of the North Sea. Journal of Sedimentary Re-
search 57, 881–892.
Hovland, M., Svensen, H., Forsberg, C.F., Johansen, H., Fichler, C., Fosså, J.H., Jonsson, R.,
Rueslåtten, H., 2005. Complex pockmarks with carbonate-ridges off mid-Norway;
products of sediment degassing. Marine Geology 218, 191–206.
Hurst, A., Cartwright, J.A., 2007. Relevance of sand injectites to hydrocarbon explora-
tion and production. AAPG Memoir 87, 1–20.
Hustoft, S., Mienert, J., Bünz, S., Nouzé, H., 2007. High-resolution 3D-seismic data indi-
cate focussed fl uid migration pathways above polygonal fault systems of the mid-
Norwegian margin. Marine Geology 245, 89–106.
Hustoft, S., Bünz, S., Mienert, J., 2010. Three-dimensional seismic analysis of the mor-
phology and spatial distribution of chimneys beneath the Nyegga pockmark fi eld,
offshore mid-Norway. Basin Research 22, 465–480.
Imbert, P., Ho, S., Le, Q.P., 2008. Funnel-Shaped Seismic Anomalies: Characterization
and Emplacement Processes. AAPG International Conference and Exhibition
2008. Abstract.
Ireland, M.T., Davies, R.J., Goulty, N.R., Moy, D.J., 2011. Thick slides dominated by
regular-wavelength folds and thrusts in biosiliceous sediments on the Vema
Dome offshore of Norway. Marine Geology 289, 34–45.
Judd, A.G., Hovland, M., 2007. Seabed Fluid Flow: the Impact of Geology, Biology and
the Marine Environment. Cambridge University Press, Cambridge. xv, 475 p.
Kallweit, R.S., Wood, L.C., 1982. The limits of resolution of zero-phase wavelets. Geo-
physics 47, 1035–1046.
Kastner, M., Keene, J.B., Gieskes, J.M., 1977. Diagenesis of siliceous oozes—I. Chemical controls
on the rate of opal-A to opaal-CT transformation—an experimental study. Geochimica Et
Cosmochimica Acta 41, 1041–1059.
King, L.H., MacLean, B., 1970. Pockmarks on the Scotian Shelf. Geological Society of
America Bulletin 81, 3141–3148.
Larson, R.L., Ladd, J.W., 1973. Evidence for the opening of the South Atlantic in the Early
Cretaceous. Nature 246, 209–212.
Lavier, L.L., Steckler, M.S., Brigaud, F., 2001. Climatic and tectonic control on the Ceno-
zoic evolution of the West African margin. Marine Geology 178, 63–80.
Levin, L.A., 2005. Ecology of Cold Seep Sediments: Interactions Of fauna with Flow,
Chemistry and Microbes. CRC Press, Boca Raton, p. 46.
Liro, L.M., Dawson, W.C., 2000. Reservoir systems of selected basins of the South Atlan-
tic. In: Mello, M.R., Katz, B.J. (Eds.), Petroleum systems of South Atlantic margins:
AAPG Memoir, vol. 73, pp. 77–92.
Løseth, H., Wensaas, L., Arntsen, B., Hanken, N., Basire, C., Graue, K., 2001. 1000 m Long
Gas Blow Out Pipes. 63rd EAGE Conference and Exhibition, Extended abstract,
pp. 524–527.
Løseth, H., Wensaas, L., Arntsen, B., Hanken, N.-M., Basire, C., Graue, K., 2011. 1000 m
long gas blow-out pipes. Marine and Petroleum Geology 28, 1047–1060.
Mascle, J., Phillips, J.D., 1972. Magnetic smooth zones in the South Atlantic. Nature 240,
80–84.
Mazzini, A., Ivanov, M.K., Nermoen, A., Bahr, A., Bohrmann, G., Svensen, H., Planke, S.,
2008. Complex plumbing systems in the near subsurface: Geometries of authigenic
carbonates from Dolgovskoy Mound (Black Sea) constrained by analogue experi-
ments. Marine and Petroleum Geology 25, 457–472.
Moss, J.L., Cartwright, J., 2010a. 3D seismic expression of km-scale fl uid escape pipes
from offshore Namibia. Basin Research 22, 481–501.
Moss, J.L., Cartwright, J., 2010b. The spatial and temporal distribution of pipe formation,
offshore Namibia. Marine and Petroleum Geology 27, 1216–1234.
Naudts, L., Greinert, J., Poort, J., Belza, J., Vangampelaere, E., Boone, D., Linke, P., Henriet,
J.-P., De Batist, M., 2010. Active venting sites on the gas-hydrate-bearing Hikurangi
Margin, off New Zealand: diffusive- versus bubble-released methane. Marine Geol-
ogy 272, 233–250.
Olu-Le Roy, K., Caprais, J.C., Fi fi s, A., Fabri, M.C., Galéron, J., Budzinsky, H., Le Ménach, K.,
Khripounoff, A., Ondréas, H., Sibuet, M., 2007. Cold seep assemblages on a giant
pockmark off West Africa: spatial patterns and environmental control. Marine
Ecology 28, 115–130.
Pantin, H.M., 1980. Late Devensian and Flandrian sequence in the Northern Irish Sea.
Paper presented to the Quaternary Research Association discussion meeting on
"Offshore and Onshore Quaternary of Northwest Europe–The scope for correla-
tion", Edinburgh, Jan. 1980.
Paull, C.K., Ussler III, W., Borowski, W.S., Spiess, F.N., 1995. Methane-rich plumes on the
Carolina continental rise: associations with gas hydrates. Geology 23, 89–92.
Petersen, C.J., Bünz, S., Hustoft, S., Mienert, J., Klaeschen, D., 2010. High-resolution P-
Cable 3D seismic imaging of gas chimney structures in gas hydrated sediments of
an Arctic sediment drift. Marine and Petroleum Geology 27, 1981–1994.
Pierre, C., Fouquet, Y., 2007. Authigenic carbonates from methane seeps of the Congo
deep-sea fan. Geo-Marine Letters 27, 249–257.
Regnier, P., Dale, A.W., Arndt, S., LaRowe, D.E., Mogollón, J., Van Cappellen, P., 2011.
Quantitative analysis of anaerobic oxidation of methane (AOM) in marine sedi-
ments: a modeling perspective. Earth-Science Reviews 106, 105–130.
Riedel, M., Novosel, I., Spence, G.D., Hyndman, R.D., Chapman, R.N., Solem, R.C., Lewis,
T., 2006. Geophysical and geochemical signatures associated with gas hydrate–
related venting in the northern Cascadia margin. Geological Society of America
Bulletin 118, 23–38.
Roberts, H.H., 2001. Fluid and Gas Expulsion on the Northern Gulf of Mexico Continen-
tal Slope: Mud-prone to Mineral-prone Responses. Washington, DC, ETATS-UNIS,
American Geophysical Union, p. 322.
Roberts, H.H., Hardage, B.A., Shedd, W.W., Hunt Jr., J., 2006. Sea fl oor re fl ectivity–an im-
portant seismic property for interpreting fl uid/gas expulsion geology and the pres-
ence of gas hydrate. The Leading Edge 25, 620–628.
Savoye, B., Babonneau, N., Dennielou, B., Bez, M., 2009. Geological overview of the Angola–
Congo margin, the Congo deep-sea fan and its submarine valleys. Deep Sea Research
Part II: Topical Studies in Oceanography 56, 2169–2182.
Séranne, M., Anka, Z., 2005. South Atlantic continental margins of Africa: a comparison
of the tectonic vs climate interplay on the evolution of equatorial West Africa and
SW Africa margins. Journal of African Earth Sciences 43, 283–300.
Sieck, H.C., 1975. High Resolution Geophysical Studies for Resource Development and
Environmental Protection. Offshore Technology Conference, Paper 2179.
Snyder, G.T., Hiruta, A., Matsumoto, R., Dickens, G.R., Tomaru, H., Takeuchi, R.,
Komatsubara, J., Ishida, Y., Yu, H., 2007. Pore water pro fi les and authigenic miner-
alization in shallow marine sediments above the methane-charged system on
Umitaka Spur, Japan Sea. Deep Sea Research Part II: Topical Studies in Oceanogra-
phy 54, 1216–1239.
Sultan, N., Marsset, B., Ker, S., Marsset, T., Voisset, M., Vernant, A.M., Bayon, G., Cauquil,
E., Adamy, J., Colliat, J.L., Drapeau, D., 2010. Hydrate Dissolution as a Potential
Mechanism for Pockmark Formation in the Niger Delta. Journal of Geophysical Re-
search 115, B08101.
Tony-George, R.A., Cauquil, Eric, 2007. AUV Ultrahigh-Resolution 3D Seismic Technique
for Detailed Subsurface Investigations: Offshore Technology Conference, Houston,
OTC18784.
Torres, M.E., McManus, J., Hammond, D.E., de Angelis, M.A., Heeschen, K.U., Colbert, S.L.,
Tryon, M.D., Brown, K.M., Suess, E., 2002. Fluid and chemical fl uxes in and out of
sediments hosting methane hydrate deposits on Hydrate Ridge, OR, I: Hydrological
provinces. Earth and Planetary Science Letters 201, 525–540.
Vignau, S., Deharbe, J.M., Ros, J.B., Boutet, C., Masse, P., Jaffuel, F., Walgenwitz, F., Gerard, J.,
Martin, R., Blake, B., 2000. Well study report: Sedimentology-Inorganic Geochemistry-
Structural Analysis-Biostratigraphy. Total S.A., internal report, vol. 2, p. 134.
Walgenwitz, F.R., Pagel, M., Meyer, A., Maluski, H., Monie, P., 1990. Thermo-chronological
approach to reservoir diagenesis in the offshore Angola basin: a fl uid inclusion,
40 Ar- 39 Ar and K-Ar investigation. AAPG Bulletin 74 (5), 547–563.
Wefer, G., Berger, W.H., Richter, C., Shipboard Scienti fi c Party, 1998. Proceedings Ocean
Drilling Program, Initial Reports, 175. College Station, TX, Ocean Drilling Program.
Westbrook, G., Exley, R., Minshull, T., Nouzé, H., Gailler, A., Jose, T., Ker, S., Plaza, A.,
2008. High-resolution 3d Seismic Investigations of Hydrate-bearing Fluid-escape
Chimneys in the Nyegga Region of the Vøring Plateau, Norway. Proceedings of
the 6th International Conferenceon Gas Hydrates Vancouver (ICGH 2008), British
Columbia, Canada, July 6–10, 2008.
Widess, M.B., 1973. How thin is a thin bed? Geophysics 38, 1176–1180.
Woods, E.P., 1991. Eocene seismic velocity anomalies from the Timor Sea. Exploration
Geophysics 22, 461–464.
Worzel, J.L., Watkins, J.S., 1974. Location of a Lost Drilling Platform. Offshore Technolo-
gy Conference, Paper 2016.

Fluid-Venting-System website by S. HO is licensed under a Creative Commons Attribution-NonCommercial-NoDerivatives 4.0 International License.