Seismic-scale funnel-shaped collapse features from the Paleocene–Eocene of the North West Shelf of Australia
Patrice Imbert *1, Sutieng Ho 2
1 Total CSTJF, Avenue Larribau, 64000 Pau, France
2 (Previously) Cardiff University, Cardiff CF10 3AT, Wales, United Kingdom
*[email protected], [email protected]
Abstract
A multi-tiered cluster of funnel-shaped seismic anomalies can be observed over 11,000 km2 in the lower Tertiary of the Carnarvon basin, NW shelf of Australia. The lithology is dominated by deep-water carbonates and marls. Individual funnel-shaped depressions typically have a diameter exceeding 1 km and a depth of a few hundred meters. The strata inside some of the anomalies can be correlated with surrounding layers. In the best documented example, the correlation shows that the infill has foundered into the funnel-shaped depression. The collapse appears to have removed about 1 km3 below sedimentary cover. The anomalies were emplaced in deep water, when gas was actively migrating in the basin and above a structural high. Based on this context, and using recently described hydrate pockmarks as live analogs, the following model is proposed for the emplacement of these collapsed features: 1) thermogenic gas migrated up into the fine-grained Paleogene series and “froze up” into hydrates upon entering the gas hydrate stability zone; 2) the correlative volume increase resulted in conical failure of the overburden and gas migrating along the failure impregnated the surrounding sediments with hydrates; 3) as the hydrate stability zone moved up, hydrate dissolution/dissociation expelled gas and associated liquefied sediment from the cone, while the non-impregnated core foundered towards the bottom of the cone. Three such episodes are recorded in the study area during the Paleogene. Two of them lie in close temporal vicinity to the main hyperthermal events of this period. Volume calculations indicate that the amount of gas released in our study area is two orders of magnitude lower than what would be needed to trigger the Paleocene–Eocene Thermal Maximum event suggesting that the anomalies are rather developed as a consequence of global hyperthermal events.
A multi-tiered cluster of funnel-shaped seismic anomalies can be observed over 11,000 km2 in the lower Tertiary of the Carnarvon basin, NW shelf of Australia. The lithology is dominated by deep-water carbonates and marls. Individual funnel-shaped depressions typically have a diameter exceeding 1 km and a depth of a few hundred meters. The strata inside some of the anomalies can be correlated with surrounding layers. In the best documented example, the correlation shows that the infill has foundered into the funnel-shaped depression. The collapse appears to have removed about 1 km3 below sedimentary cover. The anomalies were emplaced in deep water, when gas was actively migrating in the basin and above a structural high. Based on this context, and using recently described hydrate pockmarks as live analogs, the following model is proposed for the emplacement of these collapsed features: 1) thermogenic gas migrated up into the fine-grained Paleogene series and “froze up” into hydrates upon entering the gas hydrate stability zone; 2) the correlative volume increase resulted in conical failure of the overburden and gas migrating along the failure impregnated the surrounding sediments with hydrates; 3) as the hydrate stability zone moved up, hydrate dissolution/dissociation expelled gas and associated liquefied sediment from the cone, while the non-impregnated core foundered towards the bottom of the cone. Three such episodes are recorded in the study area during the Paleogene. Two of them lie in close temporal vicinity to the main hyperthermal events of this period. Volume calculations indicate that the amount of gas released in our study area is two orders of magnitude lower than what would be needed to trigger the Paleocene–Eocene Thermal Maximum event suggesting that the anomalies are rather developed as a consequence of global hyperthermal events.
1. Introduction
1.1. Rationale
As seismic quality improves over the years, there is a growing recognition that sediment remobilization after some burial plays a major role in many sedimentary basins, especially in hydrocarbon-bearing basins. Although features like injected sands have been correctly described and interpreted for over 150 years (Darwin, 1846, Diller, 1890 and Newsom, 1903), they remained underestimated until good quality seismic data showed their ubiquitous character in many sedimentary basins, starting from the North Sea (Jenssen et al., 1993 and many papers since (Lonergan and Cartwright, 1999 and MacLeod et al., 1999; Huuse and Mickelson, 2004, Huuse et al., 2004, Huuse et al., 2005, Huuse et al., 2007 and Jackson, 2007Rodrigues et al., 2009). In parallel, outcrop work was carried out from the late 1980s onwards (e.g. Surlyk, 1987 and Parize and Friès, 2003). More generally, full books or journal issues have been devoted to the subject of sediment remobilization, e.g. Van Rensbergen et al., 2003, Hurst and Cartwright, 2007 and Huuse et al. 2010.
Circular features on seismic can be related to a variety of geological phenomena (Stewart, 1999). Among those, seismic-scale downward-pointing conical features make one particular class of seismic morphology that is most of the time associated with sediment remobilization (the main exceptions being volcanic vents and conical igneous intrusions). According to literature, sediment-hosted, non-igneous downward-pointing cones can develop through two main processes: gas escape forming pockmarks (Hovland and Judd, 1988 and Judd and Hovland, 2007) and conical intrusion of liquefied sand (Molyneux et al., 2002, Shoulders et al., 2007 and Cartwright et al., 2008). Other processes such as sink holes in carbonate series lead to more cylindrical features, or roughly conical but pointing up, not down (Loucks, 1999). Pockmarks can be distinguished from conical intrusions on the basis of the geometric and temporal relationships between their in- and outside: pockmarks are typically eroded first and then filled with sediment as their activity ceases. On the contrary, conical intrusions show a keystone of host sediments “pushed up” by sand injection, so that the series inside the funnel match those outside.
The study presented here focuses on yet another type of downward-pointing conical seismic features, developed on the same scale as conical intrusions (the individual cones reported here can exceed 1 km in diameter and 200 m in depth). What differentiates these anomalies from conical intrusions is the geometry of their infill, and the way it correlates with surrounding strata.
For the sake of brevity and to avoid creating yet another acronym, we will from now on refer to these downward-pointing conical seismic anomalies as “funnel-shaped anomalies” or simply “funnels” when the context is unambiguous.
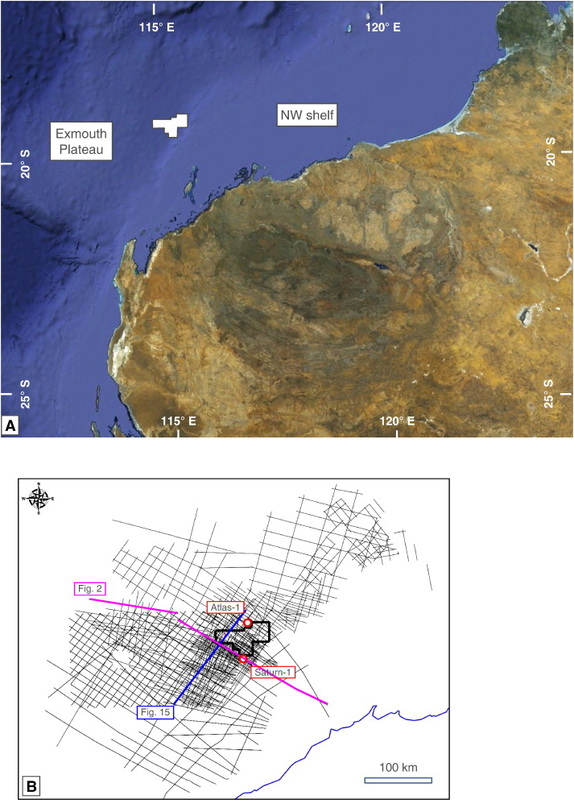
1.2. Regional setting of the studyThe studied area lies offshore the NW coast of Australia, in the Carnarvon Basin (Fig. 1). The information summarized here essentially comes from Longley et al. (2002) for the mega-regional picture (Northwest Shelf of Australia) and from a recent overview on the geology of the Carnarvon basin that can be found in a document issued by the Australian Government (http://www.ret.gov.au/resources/Documents/acreage_releases/2009/RegionalCarnarvon.pdf, last accessed 2012/07/27). The following paragraphs will recap the points of interest for the work reported here.
The Carnarvon Basin formed as the result of three main episodes of rifting during the breakup of Gondwana from Devonian to Cretaceous. The study area underwent rifting from early Jurassic (Toarcian) to early Cretaceous (Valanginian), after which post-breakup subsidence took place until mid-Santonian. From this time on, the basin evolved as a passive margin. The regional seismic line of Fig. 2 illustrates this structure, with the intra-Cretaceous horizon sealing the rifting phase. The interval of interest belongs to the lower Tertiary, and is thus entirely part of the “passive margin” phase of the evolution of the basin.
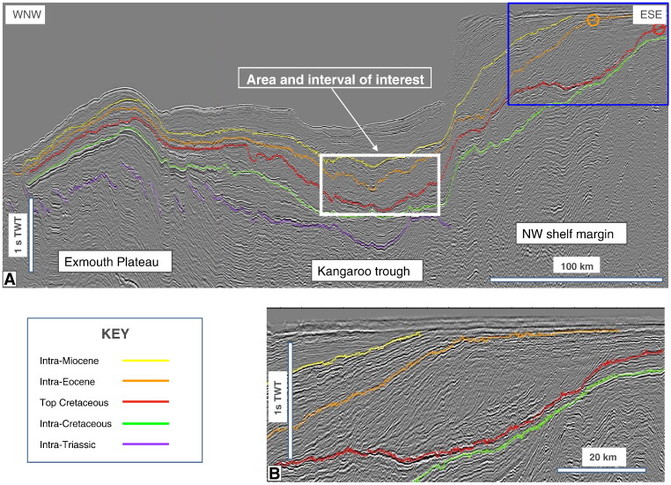
Fig. 2.
Regional seismic line. The regional 2-D seismic line across the margin illustrates the interval of interest, bounded by the red and orange markers, in its regional setting. One key point is the recognition of the shelf breaks at the top Cretaceous and intra-Eocene levels, marked by color circles. These show that the studied area remained in deep water throughout the deposition and remobilization of the interval of interest.
The main gas-prone source rock of the basin is the Mungaroo Middle to Late Triassic Formation, which consists of fluvial to deltaic deposits. The Carnarvon Basin is at present the most prolific gas-producing basin in Australia, with a number of giant gas fields discovered and under production (resource estimate as of 2009 is around 95 Tcf of gas (2.7 · 1012 m3). The area of the study is located in the zone of the main fields, indicating that the petroleum system has actively expelled gas in the area.
Another key point is shown by the line in Fig. 2: the studied area lies basinward of a series of seismic clinoforms, whose height increases from 0.7 s TWT (ca. 1 km) to 1.3 s TWT (ca. 2 km) during deposition of the interval of interest. This implies that the studied interval that currently lies in deep water was already in a deep-water setting during deposition of the studied interval. Even taking into account the deformation of the time image by the contrast between the velocity of water in the central and NW parts of the figure and the carbonate platform to the SE, the water depth at the time when the interval of interest was deposited is estimated from the height of the Paleogene clinoforms (ca. 1 km) to be at least 1 km. Biostratigraphic studies reported in Young (2001) also indicate a deep-water setting for well Saturn-1, located in a slightly more proximal position, with an estimated water depth of 500 m at the Cretaceous/Tertiary boundary and 1000 to 2000 m at the end of the Eocene (Young, 2001).
1.3. Available data
1.3.1. Seismic
About 2500 km2 of recent 3-D seismic was available for this study. Seismic resolution in the relatively shallow studied interval (ca. 500 to 1000 ms two-way transit time, i.e. about 0.5 to 1.2 km below seafloor) is about 10 ms two-way time (hereafter abbreviated to TWT), which represents about 10 to 15 m. In addition, a regional 2-D grid allowed defining the regional setting as well as the distribution of the studied anomalies at the scale of the basin. This regional 2-D grid combines lines from various vintages, with variable quality. The inline spacing of the 3-D survey is 25 m, the trace spacing 12.5 m, the sampling rate 4 ms TWT. The interpretation was carried out on the cube of the “near offset” traces. The polarity convention used for the 3-D survey is that an increase of impedance downwards corresponds to a trough. With the color palette used for the displays of the figures, this is represented by a white reflection on black-and-white lines, or by a black when a red-yellow-white-black palette is used. Most of the interpretation was carried out on the 3-D block, with a specific focus on a few well-imaged anomalies used as a reference for the interpretation.
The seismic data were interpreted in the time domain. When describing general features in the rest of this paper, two-way transit time (TWT) thicknesses will be given an approximate equivalent using the average velocity of 2500 m/s (observed on the sonic log of Saturn-1 over the interval of interest) for reference only. The corresponding depth/time equivalence is 125 m for 100 ms TWT. On all figure captions, the scale bars for the vertical axis are given in milliseconds, two-way transit time; the labels are abbreviated to “ms” in order to avoid overloading the images.
1.3.2. Well calibration
Two wells are available for calibration in the study area: the Saturn-1 well, whose lithology was thoroughly documented by Young (2001) from ditch cuttings over the whole section and the Atlas-1 well.
Biostratigraphic data are available for these two wells in the public domain as follows: the calibration of Saturn-1 is part of Young's (2001) PhD dissertation and the stratigraphic tops for Atlas are available on the website of the Australian Government (http://dbforms.ga.gov.au/www/npm.well.results, last accessed 2012/07/24).
1.4. Stratigraphy of the lower Tertiary from well data
The interval of interest is the lower part of the Tertiary slope/basin sedimentary series of the Carnarvon basin, between the Exmouth Plateau and the continental margin. Young (2001) interpreted the interval from middle Maastrichtian to late Early Miocene as a supersequence (which he terms the “Paleogene Supersequence “) “composed of 13 sequences and constrained by major regional sequence boundaries”.
1.4.1. Age dating
Stratigraphic tops for well Atlas-1 are available from the data repository of the Australian Government (http://dbforms.ga.gov.au/www/npm.well.search, last accessed 2012/07/271). They were calibrated to the seismic domain by interpolating between the seafloor and the top Cretaceous, which appears to be the most reliable marker in the area. Although Atlas-1 lies outside the area covered by the main 3-D seismic polygon (Fig. 1B), a narrow additional stripe allows horizon calibration. Fig. 3 shows the correlation between the key markers and the stratigraphic tops reported in the well. The seismic picking is considered fully reliable along this arbitrary line.
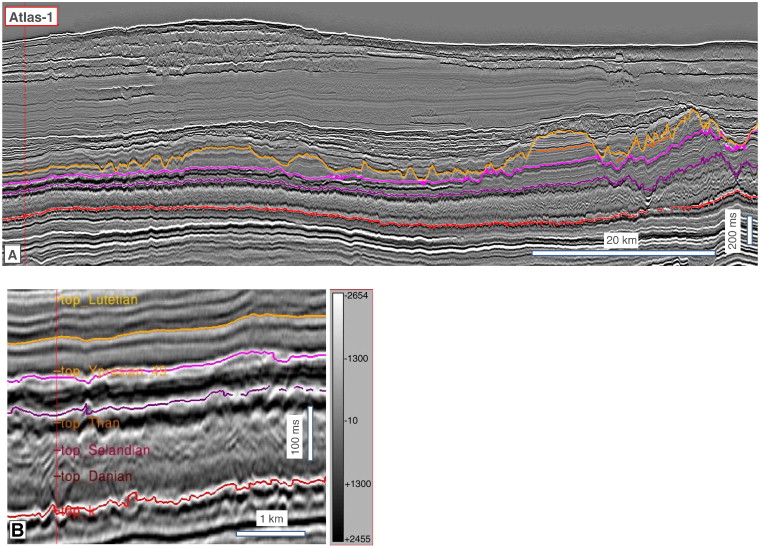
Fig. 3.
Age calibration to Atlas-1. A is an arbitrary line running from Atlas-1 to the area of interest (to the right of the picture), with the apparently erosional surfaces that are the studied features. The main three such surfaces are the purple, magenta and orange markers from base to top. These markers are easy to follow here both due to the seismic quality, and to the parallel stratal pattern that progressively replaces the “erosional” character in the vicinity of Atlas-1. B is a close-up on the vicinity of Atlas-1, and allows proposing a top Cretaceous age for the red marker, an age “close to top Paleocene” for the purple one, “close to top Ypresian” for the magenta horizon, and “mid-Lutetian” for the orange marker. Uncertainty on these ages is discussed in the text.
For Saturn-1, the calibration is given in Young's PhD dissertation (2001) as labeled markers on a seismic calibration plate, along with an error range for each marker on a chart (Fig. 4, modified with permission from Young, 2001). The two sources agree for the Paleocene horizons, but initially showed severe discrepancies in the Eocene. Saturn-1 lies outside the area covered by 3-D, so that the horizons have to be followed on 2-D lines of variable vintages and quality. Moreover, the horizons are quite disrupted by the “erosions” that make the subject of this paper (Fig. 5). An alternative picking for the middle Eocene marker (magenta on 3-D sections) of Saturn-1, based on the calibration of Atlas-1, is proposed as the pink horizon in Fig. 5. It is less satisfactory from a seismic viewpoint but overall more consistent with the rest of the data.
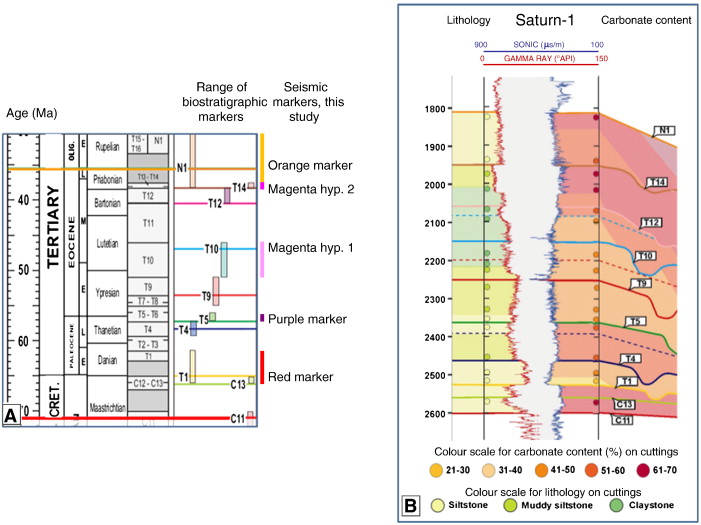
Fig. 4.
Lithological calibration to Saturn-1 (re-assembled from Young, 2001 with permission from the author). A: stratigraphic chart from Young (2001) with the biostratigraphic markers identified in the well and their uncertainty range shown as error bars on the right-hand track of the chart (C11 up to N1). The additional column to the right is an estimate of the possible range of stratigraphic ages for the key seismic markers of this study (the purple, magenta and orange surfaces) based on our seismic picking. The two hypotheses shown for the magenta markers result from two possibilities for the seismic picking, as shown in Fig. 5. B, reassembled from Young (2001) is composite log with the grain size and carbonate content overlain. The actual data are measurements on ditch cuttings, represented as small color circles in the left (grain size) and right (carbonate) margins of the well respectively. The color coding in overlay is taken from a correlation plate with other wells of the basin, and represents an interpolation/extrapolation from the measurements and the wireline logs that define homogeneous intervals. The labels from C11 to N1 on the right are the seismic markers picked by Young (2001), as shown on A.
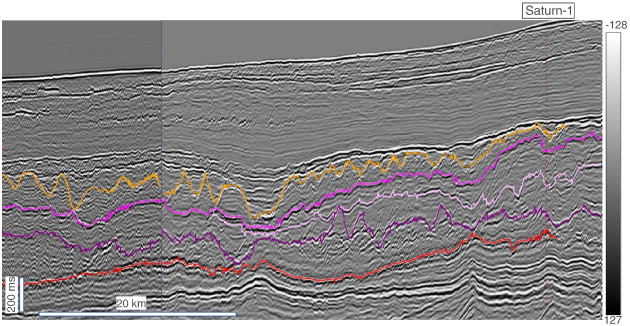
Fig. 5.
Seismic calibration to Saturn-1. The well lies outside the 3-D block, the calibration therefore goes along two 2-D lines (stitch where the thin vertical line is, about 3∕4 to the left of the image). The red, purple, magenta and orange horizons are the key markers of the study and were carried in from the 3-D block, which overlaps with the left part of the composite line. The pink horizon is an alternate possibility for the magenta marker, which gives age much more consistent with the published stratigraphy of Atlas-1 shown in Fig. 3.
1.4.2. Lithology
Calibration at well Saturn-1, which lies in the area of interest, indicates that the grain size in the Paleogene is silt/mud grade, while the carbonate content measured on the ditch cuttings of the well has a median value around 50%, and a range from 40 to 70% over most of the interval (Fig. 4B, modified from Young (2001)).
2. The Paleogene funnel-shaped depressions
2.1. General overview of the local stratigraphy
The seismic stratigraphy of the Paleogene of the area is shown on the line in Fig. 6A: above pre-Tertiary parallel reflections, the Paleogene starts with a densely faulted interval showing all the characteristics of layer-bound polygonal fault systems, as described by Cartwright (1994), Cartwright and Lonergan (1996) and Cartwright (2011). Above the main polygonal fault tier comes a slightly faulted wedge thinning to the east. These two intervals are affected by several episodes of apparent erosion, which are the subject of this paper.
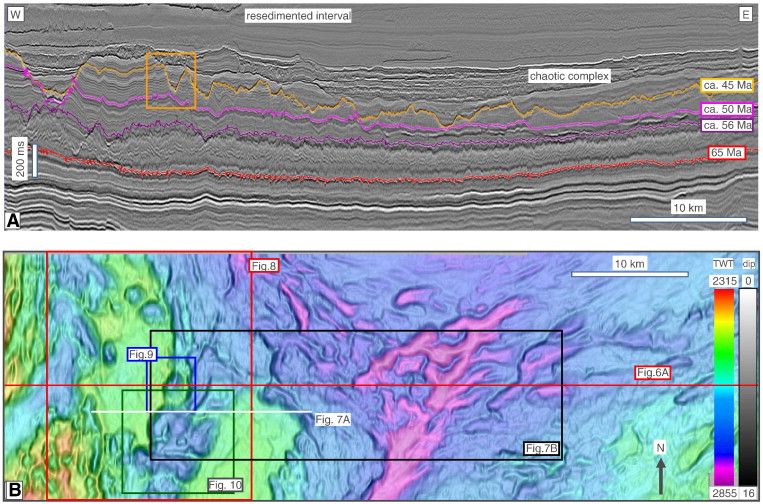
Fig. 6.
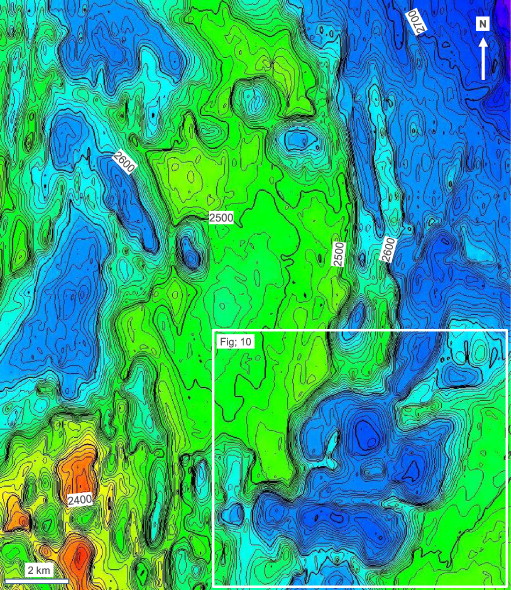
The erosional surfaces: semi-regional interpretation from the 3-D cube. A is a semi-regional 3-D line across the deep Carnarvon basin. The interval of interest is bounded by the red and orange markers (top Cretaceous and intra-Lutetian respectively). The purple (ca. top Paleocene) and magenta (near top Ypresian) horizons, along with the intra-Lutetian orange marker, correspond to the main episodes of apparent erosion. The shattered character of the lower interval (red up to purple) corresponds to a polygonal fault system (Cartwright, 2011). B is a two-way time map view of the orange horizon. It highlights the fact that the erosional process suggested by the cross-section view results in a complex topography made up of coalescing closed depressions, whose individual relief is on the order of one or a few hundred ms TWT. The next figures will concentrate on the population of funnels located in the areas of the blue and red boxes.
The most prominent of the erosional surfaces is shown in orange in Fig. 6A: the underlying interval shows a very regular, parallel and continuous seismic facies on the eastern part of the line, with high amplitude reflections; it evolves laterally to the west into a thinner, lower amplitude package. Over the whole line, the reflections are truncated by the orange marker. The angle at which the orange marker truncates underlying reflections is variable, and can reach 15° in the steepest zones. Above this orange marker comes a chaotic complex, and finally low-reflectivity series affected by abundant en masse resedimentation of lesser severity than the chaotic complex.
A focus on the apparently erosional surfaces shows that there are at least three distinct episodes recorded on the line. From bottom to top, they are picked in purple (close to the top of the polygonal fault system), magenta (at the top of the gently faulted wedge) and orange at the top of the system. In addition, as will be shown later, the top Cretaceous (red) is locally affected by similar truncations.
Based on cross-sectional view only, the purple, magenta and orange markers could be interpreted as series of canyons and erosional channels dissecting the continental slope of the time. They were interpreted in this way by Young (2001) from the 2-D data available to him at the time.
Fig. 6B is a map view of the orange marker based on the interpretation of the 3-D block. It shows immediately that most of the erosional features are actually coalescing closed depressions with a negative relief exceeding 200 ms (ca. 250 m) in many places. These features are thus more akin to pockmarks or conical intrusions than to any type of sedimentary erosional feature, like canyon or channel. They will be referred to as “funnel-shaped depressions” or simply “funnels” for all the descriptive part of this paper.
The interval of interest for this study is the “funnel-bearing” interval, which will be the focus of the rest of this paper. We will address first the geometry of these funnels, then compare the seismic stratigraphy of their inner and outer parts, and finally propose a model for their emplacement.
2.2. Background sedimentation
In the upper half of the interval of interest, when unaffected by funnel development, the background sedimentation appears as very continuous and parallel above the interval affected by polygonal faulting. Thickness variations are slow and regular (Fig. 7A). This character, combined with the grain sizes and lithology described by Young (2001), is interpreted to correspond dominantly to pelagic/hemipelagic drape, with a possible contribution of dilute and sluggish bottom currents, e.g. dilute turbidity currents, contour currents or nepheloids.
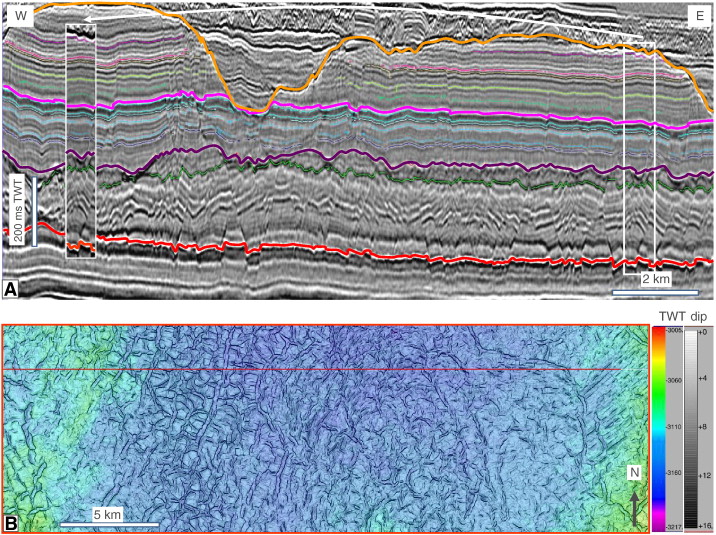
Fig. 7.
Background sedimentation. A: seismic line through an area where disturbance by funnels is limited, showing the general character of the initial deposition. Reflectors lie flat and parallel in the upper half of the interval (above the purple marker). In the lower half, there is a strong disturbance by normal faults, but individual horizons can still be followed, and tracked automatically. Leaving aside this faulting, individual horizons show the same “layer-cake” characters as the ones above. The white rectangle to the right was cut and pasted on the left as indicated by the white arrow so as to illustrate continuity. B: two-way time map of the red (top Cretaceous) horizon showing the polygonal fault pattern.
Although the lower half of the interval is affected by a polygonal fault system (Cartwright, 2011), seismic tracking of individual horizons through the faults remains possible. The stratal pattern is very similar to that of the upper half of the interval, suggesting a similar depositional process. Fig. 7B is a map of the base Tertiary highlighting the polygonal arrangement of the faults.
2.3. The funnels: geometry
The geometry of the funnels will be discussed from a couple of examples that served as a reference due to the details they show. Fig. 8 is a close-up of the two-way time map of Fig. 6B, covering about 300 km2 in the eastern part of the survey. It shows well-defined individual funnel-shaped anomalies, one of which will be described in Section 2.3.1 hereafter, while a more complex set appears in the SW part. Section 2.3.2 will detail the geometry of this complex, which was the Rosetta stone of our interpretation.
2.3.1. Single funnel
Some anomalies occur as simple isolated funnels. One of these is selected here to exemplify their general character (Fig. 9). Seen on cross-sections (9A and B), the funnel looks like a V-shaped erosional surface, with the edges dipping 10 to 20° towards the center. A time slice (Fig. 9C) or a two-way time map view (Fig. 8) indicates that the erosional surface defines a closed depression, roughly elliptical in this specific case. The contour lines on the two-way time map show that the apex of the cone lies 70 to 80 ms TWT (ca. 100 m) below the deepest part of the edge of the feature. Put together, these observations indicate that the funnels cannot correspond to a submarine valley of any sort (turbidite channel or canyon, contourite moat, etc.). The character is more that of a large pockmark.
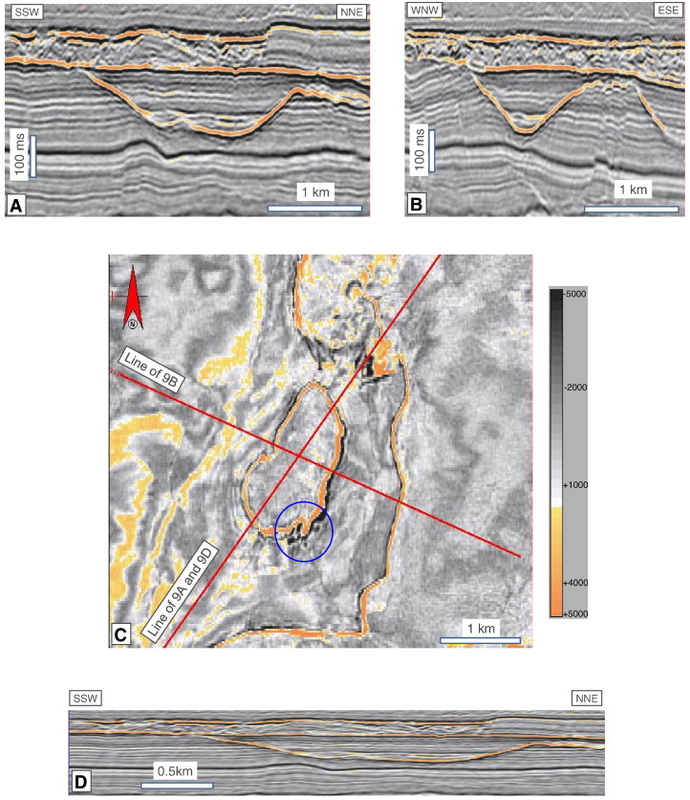
Fig. 9.
Seismic morphology of an isolated funnel. A and B: two orthogonal cross-sections highlighting the smooth morphology. The funnel wall is marked by a strong reflection, a trough-peak doublet which is roughly the opposite of the signature of the seafloor. C is a time slice showing the continuity of character all around the funnels, with the exception of a “notch” in the SSE part of the image (blue circle). D is a duplicate of A displayed without vertical exaggeration, just to give an idea of what these features really look like.
Similar funnels can be seen in Fig. 8, some almost circular and some more elliptical/elongate, with diameters ranging from 1 to 2 km or more, and depths between 60 and 120 ms (75 to 150 m). The few unaffected areas affected have an overall flat character, with minor irregularities related to the structure of the interval, itself inherited from the underlying polygonal fault system morphology.
2.3.2. Coalescing funnels
A more complex anomaly is developed immediately south of the previously described individual funnel. Fig. 10 is a close-up of the line-by-line picking of the feature. As shown by the map, the uppermost surface (orange) consists for this complex of a set of 3 or 4 major funnels, each about 300 m deep and 2 to 3 km in diameter (apices shown with large white dots on the map), with smaller, minor funnels attached (small white dots at the apex).
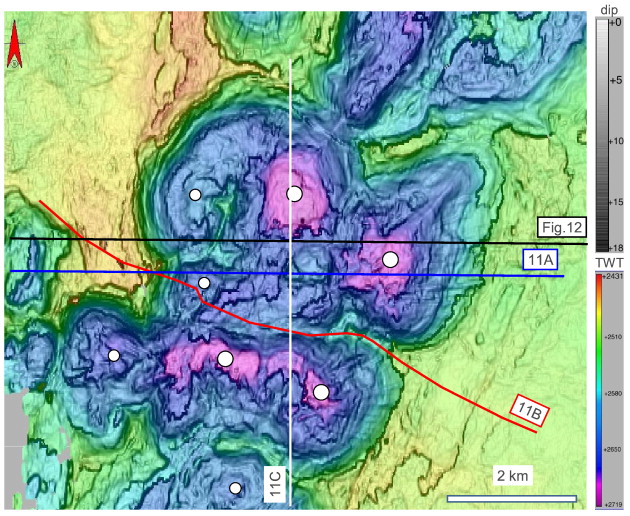
Fig. 10.
Close-up on the “Rosetta funnel cluster”. Two-way time map of the orange horizon of Fig. 3 and Fig. 6. The location is shown as a white box in Fig. 8. The dip is added in semi-transparent overlay for relief rendering. The surface is complex in detail, but clearly shows that the cluster is composed of 3 or 4 major funnels with additional smaller ones. White dots show the interpreted apices. The architecture of this funnel is detailed by a series of cross-sections on the next two figures.
The azimuth of the two-way time map of this funnel cluster highlights two types of irregularities affecting the side of the funnels: concentric step-like anomalies on the one hand, highlighted by the dip of the surface, and radial grooves especially developed on the eastern side of the set. The significance of the step-like anomalies is uncertain: some appear to develop above faults, while others may be seismic artifacts resulting from seismic interference. The interpretation of the radial ridges will be discussed in Section 2.5 hereafter.
2.3.3. Regional view of the upper set
The regional map of the uppermost “orange” horizon shown in Fig. 6B was taken for evidence that the erosion was not due to hydrodynamic processes at the seafloor. It is worth looking at it again now that the individual funnels have been described in map view and cross-section. This map shows two elongate valley-like features, one in the center and the other in the western part of the surveyed area, both outside the previously described area shown in Fig. 8. In detail, the whole surface consists of coalescing depressions, most of them elliptical to irregular and elongate. Such individual depressions are typically 1 to 2 km wide and up to 7 km long. The average depth of these elongate depressions is between 100 and 200 ms TWT (i.e. 125 to 250 m). Their orientation is variable, but they appear to occur in homogeneous zones with a common trend and character, each covering a few tens of km2.
The erosion of submarine valleys in the deep domain in most cases results in the development of an axial thalweg whose depth increases regularly towards the deep basin, i.e. without such irregularities as observed here. Submarine canyons associated with deep-sea fans for instance commonly show a meandering axial channel whose depth increases regularly downslope. Submarine valleys related to upwelling or downwelling processes (Séranne and Nzé Abeigne, 1999) exhibit a straight thalweg, but also with a depth increasing regularly basinward. Exceptions may result from local plugging of the axis by collapse of the edges (Labourdette, 2007), or correspond with the plunge pools identified at the foot of the continental slope in active tectonic settings (Farre and Ryan, 1985, Lee et al., 2002 and Bourget et al., 2011). Plunge pools along turbidite channels usually occur where an abrupt change in slope causes flow transformation (Mutti, 1992) and hydraulic jump, which does not correspond to the setting observed here. Local erosions along the axis of turbidite channels such as megaflutes (Elliott, 2000) have never been described on such a scale.
On this basis, a common non-hydraulic origin is interpreted for the formation of all the funnels observed over the area, although the two large-scale valleys observed may have developed through a first stage of erosion by hydraulic processes (e.g. turbidity currents) before undergoing modification by the emplacement of the funnels.
2.4. The funnels: reflectivity
The uppermost funnel surface (“orange marker”) is over 90% of the area marked by a positive reflection. With the polarity convention used on this survey, this indicates that the reflection corresponds to a decrease of impedance downwards. The interpretation will be fully discussed later in Section 4.3, in light of the genetic interpretation proposed for the funnels. The lower two funnel surfaces (magenta and purple) are characterized by a negative reflection, i.e. record an increase of impedance downwards.
2.5. The funnels: infill vs. background sedimentation
In most instances, the monotony of the background sedimentation makes it difficult to correlate unequivocally the inside and the outside of funnels (see for instance Fig. 9). In the specific case of the compound funnel discussed in Section 2.3.2 however, the series that infill the funnel can be correlated with the background sedimentation outside.
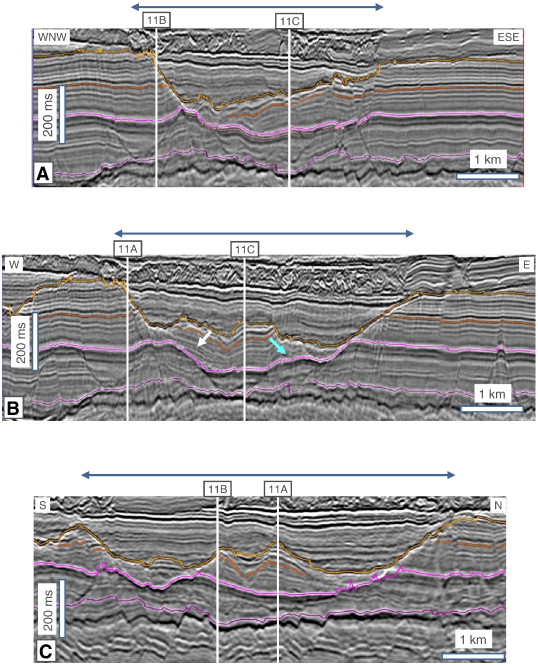
Fig. 11 shows three seismic sections across the reference compound funnel and highlights the relationships between the strata inside and outside the anomaly. The light orange at the top, magenta and purple markers are the key markers described in Section 2.1.
Fig. 11A first shows that the reflections can locally be followed in continuity between the outside and the inside. This occurs over a limited area, but leaves little doubt regarding this continuity. The dark orange marker was carried into the funnel along this or a similar line. The package limited by the orange and magenta markers shows apparent downlap to the WNW onto the magenta marker, with some disruption at the western end.
Fig. 11B shows a situation where the similarity of seismic character still makes correlation easy, although there is no physical continuity along this specific line. Some deformation is apparent in the package bounded by the orange and magenta markers, with a small depression in the middle. This interval shows apparent onlap on the magenta marker on the western side of the funnel (white arrow) and drape on the eastern side (cyan arrow).
Fig. 11C shows the most common appearance of sections across the funnel, i.e. without continuity between the inside and outside. In this specific case, as is the general rule, the seismic character of the orange to magenta package inside the funnel cluster is disrupted, for instance with a strong depression in the middle, and loses its regional parallel character. Wedging for instance can be observed to the north of the intersection with 11A.
Overall, the reflection pattern inside the funnel cluster is very different from the parallel, continuous pattern observed regionally and locally around the cluster. The characteristics inside the anomaly (wedging, local depressions, coexistence of apparent onlap, downlap and conformity) are not compatible with the depositional process interpreted for the background, i.e. hemipelagic deposition. The combination of all these characteristics, and the contrast with the well-organized and parallel character outside the cluster lead us to interpret the inside package as having collapsed into the funnel. Prior to collapsing, the package is interpreted to have shown the same characteristics as the background, i.e. continuity and parallelism.
Fig. 12 is another line across the cluster and intersecting a similar, deeper anomaly in the western, lower part of the image. The uninterpreted line of Fig. 12A shows once again the contrast between the outer and inner parts of the funnel complex. In the interpreted display of Fig. 12B, all the horizons that could be followed have been represented, once again highlighting the variety of stratal terminations and the disturbed internal character. The western contact between the inner and outer series appears in this case to be faulted, for instance along the dotted red line.
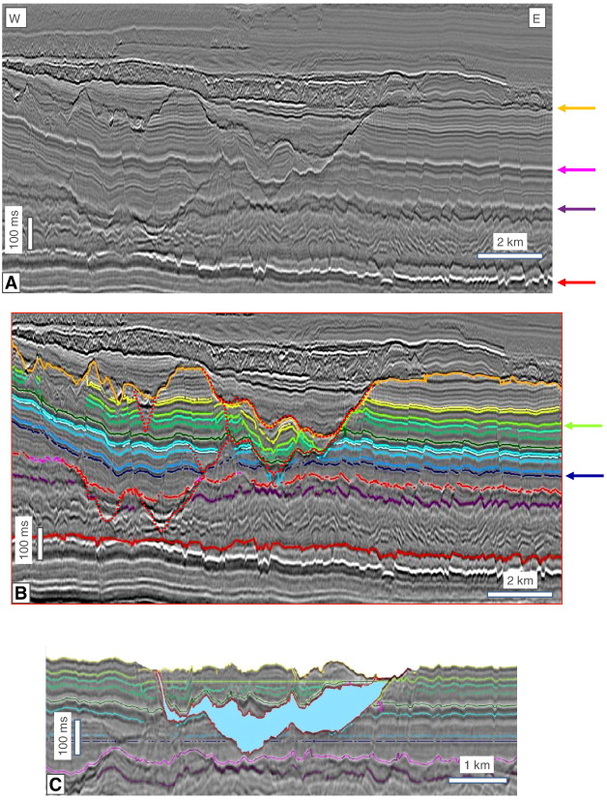
Fig. 12.
Correlation between the infill of the funnel and surrounding stratigraphy. A is an uninterpreted display of what was the “Rosetta” line of our interpretation. It shows the usual three generations of funnels, noted with the usual color code by arrows on the side, along with the top Cretaceous in red. B is an interpreted version of the same line, with almost all possible horizons picked. The interesting point is what happens with the series of green horizons: they can be followed across the limit of the funnel, which is drawn in red dots. This correlation can be made with good confidence over a small area. The lower erosion (red/purple on B) shows a similar morphology in the left-hand part of the image. Keeping in mind the regionally continuous and “layer-cake” character of the interval (Fig. 7), and the circular geometry of the funnels, this geometry is interpreted to indicate that the blue reflections show evidence for erosion under cover in the upper funnel, like the upper part of the polygonal tier in the bottom erosional depressions. C is a graphical “restoration” of the pre-collapse situation, assuming that the layers followed the general flat and parallel trend. A flattening was applied separately to the outside of the funnel on the first continuous horizon below (dark blue) and to the highest continuous horizon of the infill (vivid green). The restoration allows visualizing the amount of sediment removed in the process: roughly 100 ms (ca. 150 m) over some 10 km2, i.e. more than 1 km3.
From this view only, the interpreted collapse may seem to result from extension, for instance with a décollement at or near the horizons shown in dark blue or red immediately below. This interpretation however is not considered compatible with the map view of the anomaly (Fig. 10), which indicates an overall circular shape and nothing comparable to known extensional features. The most realistic interpretation at this stage is in our opinion that the strata that currently infill the funnel were deposited more or less in continuity with the surrounding layers and at the same level approximately, dominantly as fine-grained, hemipelagic deposits, and then collapsed below this original level.
Fig. 12C is the same section as 12A and 12B, graphically restored according to this interpretation: Two levels have been flattened separately, the dark blue marker below the funnel for the outer section, and the light green horizon for the infill. The result is an approximate restoration of what the sedimentary pile looked like before the collapse. Of course, this restoration leaves a void in the middle, roughly comprised between the dark blue and dark green markers. In other words, material appears to have been removed at depth, when it was already buried some 100 m. The implications of this observation will be discussed in Section 4.1.
2.6. Radial grooves
Fig. 13 visualizes in several ways the funnel wall, i.e. the weld of the two surfaces between which we interpret removal of pre-existing material. All three displays (see legend for details) indicate that the reflector marking the wall of the funnel is affected by short wavelength (< 100 m) furrows, as mentioned in Section 2.3.2. These furrows can be seen on the TWT + dip azimuth map of Fig. 13A to show a radial pattern converging towards (or diverging from) the apex of the funnels. A similar pattern is detectable on about half of the funnels of the area, and affects a variable proportion of their circumference. The time slice of 13B cuts the furrows horizontally. It shows in several places (circled in white) undulations of the reflection that marks the outer wall of the funnels, with a wavelength of several hundred meters. Fig. 13C is an arbitrary line cut around two of the individual funnels making the composite anomaly, along a TWT contour line of the funnel wall so as to ease the reading (location shown as a sinuous red line on the eastern side of the funnel complex in Fig. 13A). This line gives a cross-sectional view of the grooves at a constant depth in the set. The orange marker was shifted for this view only to the zero-crossing below the peak that is normally used. In a stratigraphic perspective, this reflection would be interpreted as an unconformity truncating underlying reflections and onlapped by the overlying strata. In the “collapse” interpretation proposed here, the notion of onlap does not make sense, and the irregularities are interpreted to reflect simultaneous erosion of the strata located above and below the surface, with an amplitude of 10 to 20 ms TWT (about 12 to 25 m).
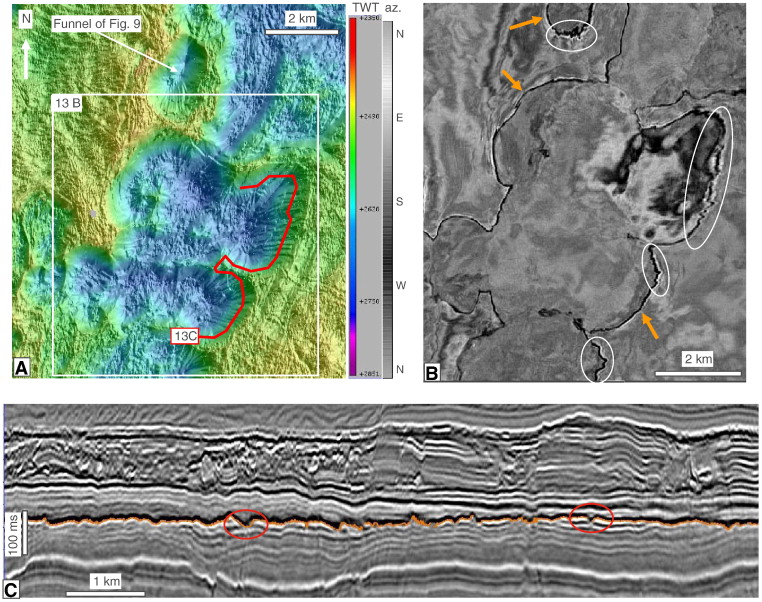
Fig. 13.
Detailed morphology of the funnel surface. A is a two-way time map of the orange horizon of Fig. 6 onto which the azimuth of the dip of the surface has been overlain in transparency. The overlay was found to be the best way of highlighting radial grooves already visible on the map of Fig. 10. The grooves appear as dominantly radial features affecting part of the circumference of the funnels. An arbitrary line was cut roughly at constant depth (red line on the map) to show the character of the grooves in cross-section. They typically develop on a scale of a few tens of milliseconds in depth and around 100 m in width. B is a time slice through the upper part of the funnel. The orange arrows show the intersection of the orange mid-Eocene marker, while the white ellipses indicate the sectors of the cluster that are affected by the radial grooves visible on A. C below is an arbitrary line cut along a contour line of the funnel (highlighted in red on A), so as to illustrate the overall erosional character (see the geometric unconformity across the orange marker), as well as the short-wavelength irregularities that correspond to the radial grooves.
3. Temporal evolution
3.1. Stacking pattern
Funnels develop in successive generations, typically with each generation expanding around the area affected by the previous one. The apices of new funnels can either be located along the wall of earlier ones, or in their vicinity without direct geometric relationship. Fig. 12B evidences three generations of funnels, with set #2 restricted to one small funnel nucleating along the edge of a deeper one. As observed on the general section of Fig. 6, the third and final episode (orange marker at the top of the interpreted section) covers the whole area of the 3D survey, and can be mapped over some 11,000 km2 using regional 2-D seismic data.
3.2. Relationships with deeper structure
Fig. 14 shows a map and a cross-section view of the oldest anomaly that could be found on the area of the 3-D survey: the interval it affects is the base of the polygonal fault system (Cartwright, 2011), i.e. the top of the Cretaceous. The map view on 13A shows a cluster of elongate rather than funnel-shaped features, but closed at both ends unlike channels, and in this way reminiscent of the blind valleys described by León et al. (2010) in the Gulf of Cadiz. The cross-section of 13B highlights that the feature developed above a significant deep-seated fault. The fault, however, is sealed below the apex of the erosion. Mapping shows that the trend of the elongate anomaly is oblique to that of the fault, with the furrows developing en échelon with respect to the deep trend rather than following it. Later funnels develop all over the place, so that it is difficult to find precise relationships with deep-seated faults.
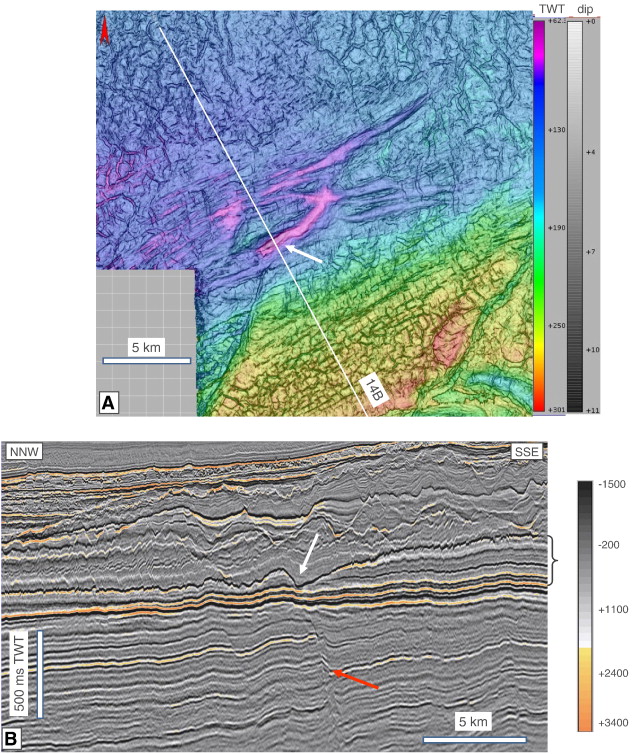
Fig. 14.
Initiation of the system. A: this two-way time map of the top Cretaceous (red horizon on other figures), with semitransparent dip in overlay for relief rendering. It shows the first funnels developed in the studied area, affecting the top Cretaceous. The funnels here are actually very elongate rather than sub-circular like their Paleocene successors. B: cross-section view showing that the funnel locally sits above a deeper fault. Comparing the maps shows that the funnel is oblique to the fault. It is thought however that the fault played a role in focusing fluids into the place, and that a permeability heterogeneity guided the gas once it had reached this level through the fault.
3.3. Relationships with the petroleum system
The anomalies are restricted to a specific area of the Carnarvon basin and develop over a limited time span, roughly from the earliest Tertiary up into the Eocene. The seismic line of Fig. 15 shows that the affected area actually expands up from isolated funnels affecting the base Tertiary into a laterally more extensive area at mid-Paleocene level and ultimately into what maps as a 11,000 km2 zone, still more or less centered on the location of the initial top Cretaceous anomaly.
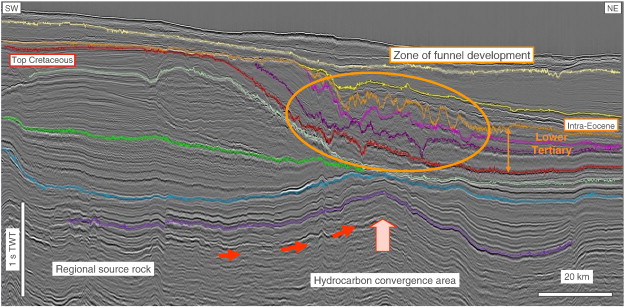
Fig. 15.
Regional petroleum system vs. funnel development. This regional line through the study area shows that the development of funnels is restricted to the area circled in orange. The series outside this area show a normal, parallel, obviously depositional behavior (leaving aside the polygonal fault system (Cartwright, 2011) that affects the lower Paleocene, between the red and purple markers. This area clearly coincides with a deeper regional high, i.e. a convergence point for hydrocarbons. Regional geochemistry studies (unpublished) appear to indicate that the onset of funnel development coincides with the time when the source rock begins to expel hydrocarbons in the south-western part of the line.
Regional data indicate that the Triassic source rock may have reached the gas window during the Cretaceous (Goncharov et al., 2006). The regional seismic line of Fig. 15 shows that the funnels develop right above a high point of the Mesozoic series below the studied interval, in other words above a structure that can focus hydrocarbon migration. Without firm evidence, these data lead us to suggest gas generation as potentially being linked with the subsurface removal of large amounts of material.
4. Processes and discussion
4.1. The issue of the missing series
The issue is summarized in Fig. 16: contrary to conical intrusions (Molyneux et al., 2002) where material is inserted from depth to make up the anomaly and lifts up a lid of host material (Fig. 16B), it appears that material here was removed from already deposited series, i.e. underneath some significant sedimentary cover, up to several hundred meters (Fig. 16C and D). Several processes were successively envisioned for that removal.
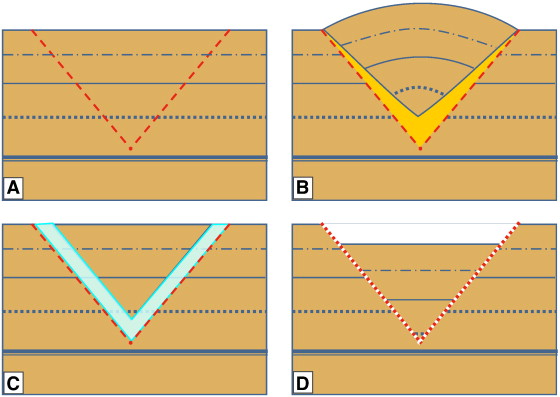
Fig. 16.
Various expressions of conical remobilization. A: initial situation where the shallow part of a sedimentary succession is affected by a conical fracture due to overpressure at the apex (typical scale for the box: 100 m thick and 1 km wide). The various line styles represent stratigraphic markers for visualization of the process. B: conical intrusion: additional material (gold) is pumped up from the deep and freezes in the conical failure. This may occur with magma or with sand. C: if the failure is caused by gas and is located in the hydrate stability zone, gas may flow through the fracture and freeze into hydrates along it, impregnating a certain thickness of sediment on the side if there is porosity and permeability. D: in the case of a hydrate-impregnated fracture like C, dissociation/dissolution will eventually occur, remove the blue (hydrate-bearing) domain, and cause the collapse of the roof of the structure.
4.1.1. Carbonate dissolution
The lithology of the series, as shown by a number of exploration wells that penetrated it, is dominated by calcareous shales and fine-grained pelagic carbonates (Fig. 4 and Young, 2001). Karstic dissolution was thus initially considered as an option. However, keeping in mind the fact that the area always was in very deep water during the interval of interest (Fig. 2), the karst would have to be a deep-water variety that has not been widely described so far. Although a mechanism like hydrothermal dissolution could convincingly explain carbonate dissolution in deep-water settings, it is difficult to imagine how such a process could result in conical dissolution in otherwise homogeneous series. In addition, although the series are carbonate-dominated, the amount of soluble CaCO3 is around 50% of the series, maximum 70% in some intervals (Fig. 4), and dissolution should in any case leave behind a very significant amount of material, which is not observed.
Moreover, the morphology of the collapses and the deformation style of the foundered block do not match that of brittle collapse, either above magmatic chambers (calderas, Anderson, 1936) or above caves (Loucks, 1999). Deformation looks much more plastic (Fig. 11 and Fig. 12), once again suggesting a lithology closer to poorly consolidated marl than to cemented limestone.
4.1.2. Abrasion
The radial grooves shown in Fig. 13 are interpreted to record the erosion of material both below the orange marker and above, the latter process being akin to what Vigorito et al. (2008) interpreted as “scalloping” along sandstone dykes. One way of removing the sediments could be to erode them with a fluid flowing along a conical failure, the grooves observed on the wall of the funnels being the indication of this abrasion. The main difficulty here would be to explain how radial flow could be sustained and erode symmetrically all around the cone: it seems intuitively that some preferential “vent”, or possible a few, should rapidly develop and focus the flow of abrasive, presumably sediment-laden fluids. Abrasion by fluids flowing from a deeper interval (e.g. water or free gas) is thus not considered a realistic option to explain the radial grooves.
4.1.3. Dissociation of massive gas hydrates
When it became apparent that the timing and location of the emplacement of the anomalies were related respectively to the maturity of the source rock in the area and to the convergence zone of hydrocarbons (as discussed in Section 3.3 above), it was attempted to relate the observations to the supply of hydrocarbons. The option that was first considered was the emplacement, then dissolution of massive hydrates that would initially have filled the gap highlighted in blue in Fig. 12C. One difficulty with this interpretation is that it advocates the presence of thick (ca. 100 m) massive hydrates, a situation that has never been observed on this scale. The maximum thickness of hydrates ever penetrated by dedicated oceanographic drillings is about 4 m at site 570 of DSDP leg 84 (Ginsburg and Soloviev, 1998), and most hydrates found in hydrate-rich sediments consist of nodules or veins a few centimeters in diameter/thickness (e.g. Malone, 1985, Abegg et al., 2006 and Mazurenko et al., 2009). Another difficulty is that the massive hydrate should have behaved just like a conical injection (Fig. 16B) upon its emplacement, uplifting a keystone of formation above its initial level. Hydrate dissociation should then put this keystone more or less back to its initial situation (and likely deforming it during the process) rather than remove the material, as is observed here.
4.1.4. The “collapsed hydrate pockmark” hypothesis
4.1.4.1. Possible live analogs in Nigeria
While the seismic interpretation was carried out, examples of hydrate pockmarks were being surveyed in Nigeria and the results shown in symposia. One example (Fig. 17, cf. George and Cauquil, 2007) shows a sub-circular feature about 600 to 800 m in diameter with a slight negative relief and marked by a peripheral rim (Fig. 17B and C). High amplitude patches in the middle of the depressed zone (Fig. 17D) were shown by coring and CPT measurements to correspond to a plug of gas hydrates (Sultan et al., 2010), and reflectivity below the seafloor led to interpret a plug of hydrates inside the infill of the pockmark.
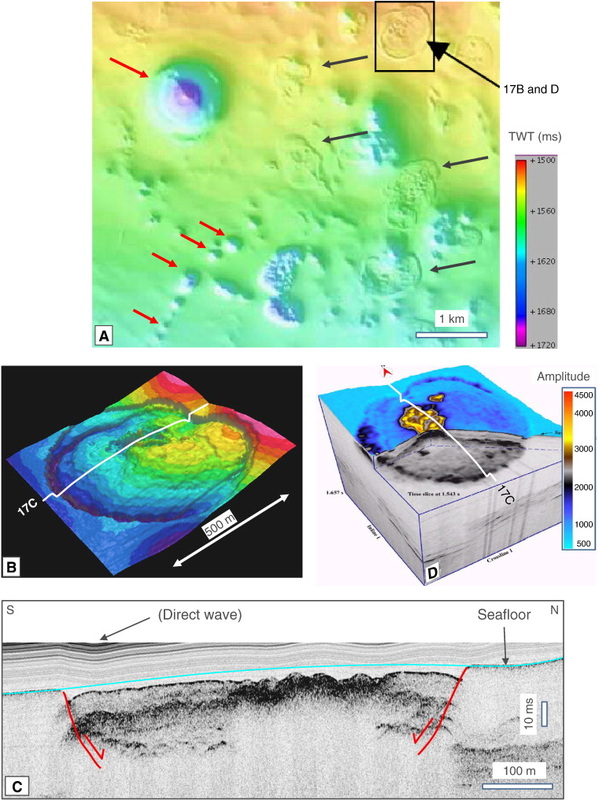
Fig. 17.
A possible modern analog from Nigeria (documents provided by E. Cauquil, cf. George and Cauquil, 2007). A is a two-way time map of the seafloor of the deep-water part of the Niger delta. It shows a series of pockmarks, with two contrasting morphologies. Pockmarks with reds arrows are classical funnel-shaped depressions, presently empty. Black arrows point at circular to elliptical shapes with a flattish, but very irregular bottom. They have a conspicuous outer rim in slight negative relief. B is a 3-D rendering of the irregular pockmark noted with a big arrow on A. The display highlights the outer rim and the detail morphology of the irregular bottom, marked by small pinnacles and craters. C is a very high-resolution seismic line (AUV chirp) across the same irregular pockmark. The seafloor and its interpolation above the pockmark are shown with a cyan line (our interpretation on the figure of George and Cauquil (2007)). The morphology of the outer rim suggests foundering of the inside part of the pockmark down into the central part, in a way that recalls what is observed on a bigger scale in our Australian example. Finally, the infill of the pockmark shows strong amplitude anomalies, both at the surface in the area of the pinnacles and about 10 ms below in all the inside part of the pockmark. D is a 3-D rendering of the seismic cube along with the amplitude of the seafloor draped on the bathymetry. Yellow corresponds to high amplitude values, cyan/blue to low values. Sampling showed that the bright patch near the center of the pockmark (yellow) corresponds to methane hydrates, suggesting that hydrates are probably responsible for the deeper amplitude patches as well. Combined together, these observations make this Nigerian irregular pockmark a possible live analog for the observations made in the Carnarvon Basin.
The final interpretation published by Sultan et al. (2010) and based on a whole series of pockmarks in the area is that the feature shown in Fig. 17 is one stage of evolution of pockmarks, which goes from initial impregnation by hydrates to their final dissolution and demise. In the case studied by George and Cauquil (2007) and Sultan et al. (2010), the final stage of the evolution is an empty crater at the seafloor (full suite of evolutionary sketches in Sultan et al., 2010, their Fig. 21). Funnel-shaped pockmarks shown by red arrows in Fig. 17A would represent in Sultan et al.'s interpretation the final stage of evolution.
The main difference between our observations and those of Sultan et al. (2010) is that the funnels reported here were fossilized with their collapse strata partly preserved. The conical shape, which is very characteristic of the Australian observations, does not really appear on the Nigerian example either, perhaps due to the different patterns of seismic acquisition resulting in a different penetration/resolution.
4.1.4.2. Why the conical shape?
The fact that the studied depressions develop either as isolated funnels or in clusters where individual funnels can be distinguished is interpreted to indicate that gas was supplied to the system via discrete entry points, one at each funnel tip. The decrease in permeability likely to result from hydrate emplacement may cause lateral deflection of the incoming gas. This process however should progressively build a hydrate patch along the zone of hydrate stability, possibly with free gas trapped underneath (resulting in a bottom-simulating reflector on seismic images), but not a conical feature.
The similarity between the morphology of the hydrate funnels and conical sandstone (or magmatic) intrusions suggests a common process at some stage. The apical angle of all these morphological anomalies falls in the same range, 130° to 160° (i.e. the edges of the funnel dip 10° to 25° inward), to be compared to the 10° to 30° described for magmatic intrusions (Hansen and Cartwright, 2006) or “average 26° ± 2°” for sand intrusions (Shoulders et al., 2007). As stated above, the most obvious difference is that conical intrusions add some material from below (sand or magma) that is then fossilized in the system, while the Australian anomalies correspond to the removal of material, including some that is interpreted to have been present (normally sedimented in lateral continuity with the surroundings) prior to being removed.
The shape of the funnels suggests that conical failure of the overburden took place at a level obeying the same mechanical rules as in conical intrusions (Mourgues et al., 2011). The hypothesis made here is that the corresponding (conical) fractures then acted as conduits for gas migration, so that gas eventually froze into hydrates following the conical path and impregnating sediment surrounding the failure surface(s).
A potentially weak point of this reasoning is that it implicitly assumes that the base of hydrate stability matches the depth at which conical failure occurs, while the two phenomena should be independent. Recent observations made at IFREMER however appear to indicate that the two phenomena could be independent, with gas migrating vertically into the hydrate stability zone up to a critical depth at which it freezes within the stability zone (V. Riboulot, pers. com., 2012). The two processes therefore need not be as strictly coincident as shown in Fig. 18.
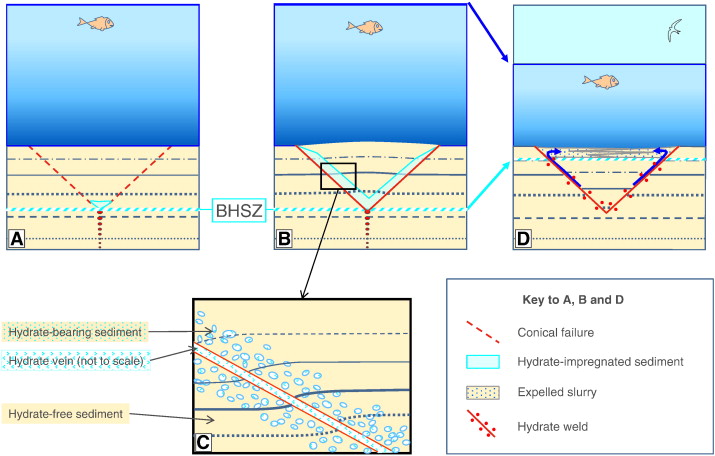
Fig. 18.
Interpreted process: hydrate growth and dissociation in a single funnel. A: depicts the first stage of the model, when a fracture is initiated from the base of the hydrate stability zone (BHSZ). The failure of the shallow sediment along the dotted red line is interpreted to be triggered by the volume increase related to hydrate formation above a focused input of gas (symbolized by the vertically stacked red circles). B: once the overburden is fractured, additional gas preferentially flows into it and diffuses over time into the adjacent rocks. To account for the sediment volumes removed, the thickness of hydrate-bearing sediment around the fracture (or fracture network) must be several tens of meters. C: schematic close-up on the hydrate-impregnated volume: the fracture (or fracture network) itself may be filled with massive hydrates (over a few centimeters?), but most of the hydrates are thought to be dispersed as nodules and veins around the main fracture). D: in a final stage, hydrate dissociation (e.g. under the influence of a relative sea-level fall, or change in ocean temperature) results in the liquefaction of the hydrate-bearing sediment and its expulsion to the surface along the initial failure surface. The former failure surface juxtaposes sediments that initially lay several tens of meters apart. It may be considered as a “hydrate weld”, by reference to the salt weld concept of Jackson and Cramez, 1989.
4.1.5. The fate of the missing sediment
The key issue at this stage is the final destination of the removed sediment. No evidence was found so far in the area of sediment flows radiating from the anomalies, nor of a thickening of strata around the anomalies. Two explanations can be envisioned: first, some wedging inside the infill (Fig. 12, above the orange marker) may suggest progressive resedimentation inside the collapse during subsidence, for instance as slurry deposits (“gumbo” mud/ooze mixture; Mondshine and Kercheville, 1966). The final geometry, however, generally indicates a net loss of sediment, meaning that at least part of the expelled material was lost “for good”, i.e. likely expelled as plumes of dilute sediment (MacQuillin and Fannin, 1979) that were carried away by oceanic currents. The outer surface of each funnel would thus correspond to a “hydrate weld”, in the same sense as was defined by Jackson and Cramez (1989) for salt welds.
The grooves that radiate from the apex of the funnels are in this hypothesis directly related to erosional flow lines of the expelled material. They resemble in a way the grooves commonly observed at the base of large-scale mass transport complexes (Weimer, 1991, Moscardelli et al., 2006 and Bull et al., 2009). The difficulty mentioned about abrasion by fluids in Section 4.1.2 is greatly alleviated in the “hydrate hypothesis”, because the presence of hydrates means that expulsion may be multi-phased, and hydrates can heal a conduit/groove before the next one is activated.
4.2. Wrapping up the process: individual funnel
The previous section showed how successive scenarios were envisioned and dismissed or progressively amended over time. This section will propose an emplacement model based on all the observations made, in light of the observations of George and Cauquil (2007) and Sultan et al. (2010), and considered at present as the most likely.
Fig. 18 depicts the interpreted emplacement model for one individual funnel, as follows:
•The emplacement is initiated when a focused gas supply reaches the base of the hydrate stability zone, thereby nucleating and growing a hydrate plug (Fig. 18A). This plug likely consists of a preferential concentration of hydrate nodules and veins in a “small” area (a few tens or hundreds of meters), most probably not a massive hydrate body.
•The growth of this plug corresponds to a volume increase in a restricted area. The resulting pressure ruptures the overburden in the same way as sand or magma intrusions do when they reach a critical depth, as shown by Mourgues et al. (2011) from analog experiments.
•The failure of the overburden along a cone favors gas migration along this cone, just like the intrusion of sand slurry in the case of conical sand intrusions. Gas can enter the hydrate stability zone due to the increased permeability along the failure zone and progressively impregnates the surroundings of the fracture (either in matrix porosity of the fine-grained material, or through fracture dilatancy) at the tip of the propagating conical failure (Fig. 18B). The result is the development of a hydrate-impregnated cone, up to a hundred meters thick, around the conical failure (close-up in Fig. 18C).
•When stability conditions change, for instance in relation with a relative sea-level fall and pressure decrease, or with an increase in ocean temperature, hydrates dissociate or dissolve, turning the sediment they previously impregnated into a slurry/gumbo-like mixture with low density. The combination of liquid behavior and buoyancy favors the expulsion of gas and sediment together, so that the non-impregnated keystone founders into the funnel. Grooves on the flanks develop as the slurry is expelled (Fig. 18D). The outer surface of the funnels therefore represents a weld, in the sense defined by Jackson and Cramez (1989) for salt welds.
The main difference between the model proposed here and the one developed by Sultan et al. (2010) to account for their observations made offshore Nigeria is the preservation and collapse of the inner part of the funnel.
4.3. Significance of the key seismic markers
The significance of the main three markers (orange, magenta and purple) could not be fully understood before the process was interpreted. Fig. 19 summarizes the significance of these key markers (Fig. 19A) and the variable seismic character of the hydrate welds (Fig. 18B). The key markers (orange, magenta and purple) combine segments of normal stratigraphic contact between the series above and below, and segments where this contact is abnormal, through a weld. They are in that respect an exception to the standard rule of seismic stratigraphy, which states that seismic reflections correspond to stratigraphic time lines (Vail et al., 1997).
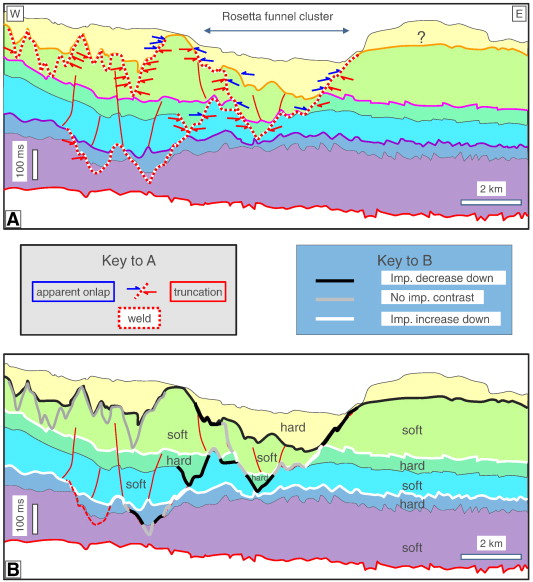
Fig. 19.
Significance of the key markers and variable seismic character of hydrate welds. Both line drawings are based on the seismic line of Fig. 12. A: highlights the stratal terminations around weld surfaces, with truncations underneath and apparent onlap above. The question mark in the eastern part of the sketch indicates that the stratigraphic attribution of the package lying at the top of this compartment is uncertain in the absence of convincing correlations at this stage. The dotted red lines mark the location of the three main welds. B: shows the seismic polarity to be expected along the welds (with the convention used here, an increase of polarity downwards is marked by a white on black and white displays, while a decrease of impedance is shown by a black). Grey lines denote the segments of the weld along which the contrast of impedance is low, usually because the juxtaposed intervals have roughly the same impedance.
Correlatively, a hydrate weld can be expressed with different seismic polarities, depending on the relative impedance of the series it juxtaposes. The best example is shown by eastern margin of the “Rosetta funnel cluster” where the weld surface is composed of segments with a positive reflection (decrease of impedance downwards), with a negative reflection (increase of impedance downwards) and with no reflection, just an offset of the horizons.
4.4. Basin-scale emplacement model
There are several successive generations of funnels, each apparently developing at a depth of a few hundred meters below seafloor (Fig. 12B). The following overall process is proposed to account for the observations made.
4.4.1. First funnel
The first hydrocarbons generated in the adjacent depocenter migrated laterally through the underlying Mesozoic reservoirs up to the regional high (Fig. 15). Vertical migration started then, up into the shales and fine-grained carbonates of the lower Tertiary. The water depth at the time allowed the formation of gas hydrates, restricted first to the apex of the underlying structure where the gas column was highest, so that the pressure at the top could exceed the fracture pressure of the overburden.
4.4.2. Successive generations
As hydrocarbon generation increased, a higher gas column started developing over the regional high, so that vertical migration started emanating from a number of points scattered over a wider area. The model is summarized in Fig. 20. The succession of imbricated funnels is interpreted to reflect successive episodes of growth and dissociation of hydrates under the influence of changes in pressure (through relative sea level) and/or temperature. A relative sea-level rise (pressure increase) would push the stability domain downwards (Pecher et al., 1998 and Pecher et al., 2001), resulting in the formation of new apices on the outer surface of an earlier funnel; conversely, a relative sea-level fall or an increase in sea bottom temperature would result in increased dissociation, gas release, pressure increase and rupture of the walls of the funnel.
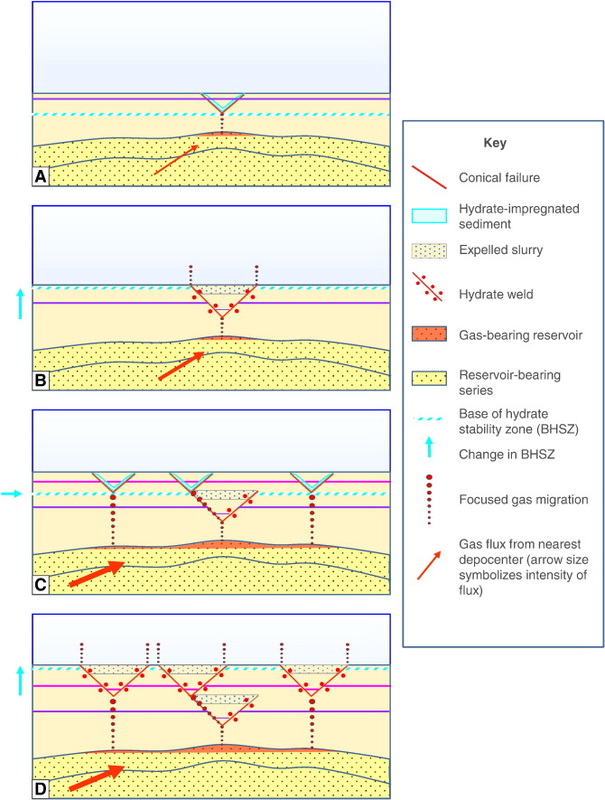
Fig. 20.
Interpreted process: succession of episodes on a semi-regional scale. This series of sketches shows how a succession of episodes of rise and stability of the base of the hydrate stability zone (BHSZ) can lead to the observed architecture of successive generations of funnels. The symbols used and color code are the same as for the previous figure. The arrow in the lower series symbolizes gas influx from the deep. The increase observed in the number of funnels upwards is interpreted on this sketch to result from an increase in the amount of gas provided, resulting in a wider supply zone (initially single entry point, then multiple points). The BHSZ is drawn here as reaching the seafloor during high episodes; it may as well disappear altogether. A: emplacement of first hydrates as per the mechanism described in Fig 16. The apex of the cone is drawn coincident with the base of hydrate stability zone (BHSZ), but this need not be the case. B: the blue arrow on the side symbolizes a shallowing of the BHSZ, which could be due to pressure decrease (e.g. RSL fall), temperature increase (e.g. global warming) or any combination thereof. The collapse of the previous cone juxtaposes a series of different ages: it is a hydrate weld, noted with the double dots, like salt welds in Jackson and Cramez (1989). C: increase in gas supply so that the area of leakage increases. The base of hydrate stability zone thickens due to thermodynamic conditions favoring stability (e.g. RSL rise or temperature decrease), so that continued gas migration into the system results in another episode of conical failure, etc. D: same as B, with more venting points, resulting in a morphology similar to that observed for instance in Fig. 12 and Fig. 19.
During each episode of dissociation, free gas would liquefy the fine-grained sediment it initially impregnated and carry it up to the surface either as slurry or as very dilute sediment plumes. The former would be resedimented around the emission point, contributing to the (partial) infill of the collapse, while the latter would be expelled and diluted into the water column.
4.4.3. Discussion: timing vs. global events
It is possible to constrain the main phase of evacuation by the age of the correlative surface of the hydrate weld around the anomalies. Age calibration from well Atlas-1 located about 40 km to the NE of the studied funnels (Fig. 3) allowed ascribing the following ages to the main three episodes of dissociation:
•just above top Thanetian (purple marker)
•around top Ypresian (magenta marker)
•around mid-Lutetian (orange marker)
The most widespread removal of sediment corresponds to the third, mid-Lutetian episode.
It is interesting to note that the first episode lies in close temporal vicinity to the Paleocene–Eocene thermal maximum (PETM), which corresponds to a sharp increase of ocean temperatures over a very short span of time, both at the surface (Kennett and Stott, 1991, Zachos et al., 2003 and Tripati and Elderfield, 2005) and at the sea bottom (Thomas and Shackleton, 1996). A full discussion of this event can be found in Sluijs (2006) and references therein. This major hyperthermal event is interpreted to result from methane release due to rapid maturation of hydrocarbon source rocks by magmatic intrusion during the opening of the north Atlantic Ocean (Svensen et al., 2004 and Svensen et al., 2010).
The second episode, around top Ypresian, lies in close temporal vicinity (within the approximations made and uncertainties of the calibration) to the “Azolla event” (Brinkhuis and Schouten, 2006). The prominent mid-Lutetian episode would rather fall after the Eocene climatic optimum and does not appear at this stage to coincide with any well-documented isolated hyperthermal event.
A quick calculation was made to assess the possibility of the observed funnels to represent an alternative methane release process to the contact metamorphism of organic-rich sediments around sill intrusions proposed for the PETM (Svensen et al., 2004 and Aarnes et al., 2010). Calculations were made simply by multiplying the surface affected by the process by the average thickness impregnated by hydrates, and an estimated percentage of hydrates in the impregnated zone. All figures were taken as orders of magnitude and are not meant to be exact, and when in doubt were taken on the high side, thus overestimating the final result in order to test the hypothesis, as follows.
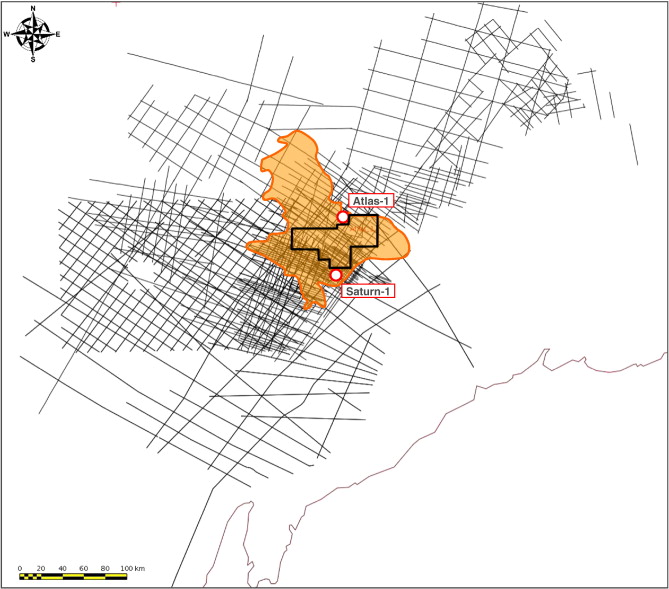
There are three episodes of dissociation, the last and most widespread of which affected an area of about 11,000 km2 (Fig. 21) over a thickness of over 100 m. This means that about 1200 km3 of rock was removed in this last episode of interpreted hydrate dissociation/dissolution. Assuming a hydrate content of 25% (which is quite high compared to what is commonly recovered from cores), the amount of hydrates dissociated in the process would be about 300 km3. Upon dissociation, 1 m3 of pure methane hydrate releases 164 m3 of methane in standard conditions (Kvenvolden, 1998). The volume of methane released per episode is then 5 · 104 km3, i.e. 5 · 1013 m3. Taking a molar volume of ca. 24 l for methane, and 12 g of carbon per mole, 1 m3 corresponds to 0.5 kg of carbon, meaning that the last episode of funnel emplacement may have released up to ca. 25 Gt of carbon.
Pape et al. (2011) calculated the amount of hydrates trapped in the upper 2.65 m of subseafloor series in an active seepage area of the Black Sea offshore Georgia based on shallow coring. They came to the conclusion that the amount of hydrates was about 20 kt/km2 for a 2.65 m-thick unit, i.e. about 6 Mt of C per km3 of hydrate-bearing sediment in a zone where the flux of methane seepage is high. Our average estimate here is about 2 Mt of C per km3 of host rock and has a comparable order of magnitude.
Bice and Marotzke (2002) estimated that the release of 2000 Gt of carbon by hydrate dissociation would be needed to account for the observations made at the PETM, while Panchuk et al. (2008) estimated that 2500 to 6800 Gt of carbon would be necessary. In any case, even the maximum quantity estimated for the funnels of the Carnarvon basin falls short of these amounts by 2 orders of magnitude. The funnel-making episodes observed in the Carnarvon basin may be related to the Eocene hyperthermal events, but can by no means be their direct cause under the currently accepted hypotheses.
Recent publications have proposed the intrusion into hydrocarbon source rocks of magmatic sills related to the opening of the north Atlantic as the triggering mechanism for the PETM (Svensen et al., 2004, Svensen et al., 2010 and Aarnes et al., 2010). In this perspective, the formation of the funnels of the lower unit (ca. top Thanetian) could be a direct consequence. It would have a very slight positive feedback effect on the warming by increasing the amount of methane released by about 1%.
The second (near top Ypresian) and third (mid-Lutetian) episodes may either be the local consequence of another episode of contact metamorphism somewhere in the world, yet to be documented, or be a small part of global warming episodes triggered by hydrate dissociation.
5. Conclusion
This study provides the first documented example of clusters of km-scale conical collapse features. We interpret these as fossil hydrate pockmarks, marked by the successive emplacement and dissociation of hydrates along conical failures. The observations fit in a basin-scale model where a link is evidenced between sedimentation and maturation of a source rock, expulsion and lateral migration of methane up to the crest of a regional structure first, then widespread expulsion at semi-regional scale.
The process interpreted here may account for the morphology of a number of recently reported observations of “bizarre pockmarks”, e.g. the pockforms of Iglesias et al. (2010), or the flat-bottomed pockmarks of Sun et al. (2011), as well as the crescent-shaped pockmarks of Sun et al. (2011).
It is suggested that a number of “channels” seen on regional, loose grids of 2-D seismic may turn out to be collapsed pockmarks once more data become available, just like when the Eocene “valleys” of the North Viking Graben in the North Sea became recognized as conical intrusions as soon as 3-D seismic came into the picture and revealed their circular morphology in map view.
The fact that the interpreted regional release of greenhouse gas (methane in this specific case) coincides within the range of the calibration uncertainties with known global hyperthermal events suggests the possibility of a causal relationship. It is interesting to note that what appeared at first glance to be a massive phenomenon affecting more than 10,000 km2 falls short by 2 orders of magnitude of what would be needed to trigger these hyperthermal events. Were hydrate dissociation in deep-water settings the global trigger, observations like what is reported here should occur over areas totaling about 1 million km2 (100 times more than the 11,000 km2 of the Carnarvon basin, assuming the same process and hydrate content, which was already on the high side). A more likely interpretation is that hyperthermal events like the PETM resulted in the destabilization of the hydrates of the Carnarvon basin and triggered the collapse observed.
___________________________________________________________________________________________________________________________________________________
Acknowledgments
Three colleagues had a very special contribution in helping us to find the solution to the initial “riddle of the stone-eater”, when we were at a loss with the problem of the missing material: Ghislain Choppin de Janvry, who shared with us his feeling for hydrates when he saw the amount and size of what we thought at the time were pockmarks; Patrick Le Quellec, who as the regional geologist in charge realized that our anomalies developed above the regional hydrocarbon convergence point just when the source rock began to expel hydrocarbons; and Didier Drapeau, then in charge of collaborations with IFREMER, who informed us about the Nigeria hydrate pockmarks that dissociate from the bottom, i.e. what we now think is the closest present-day analog to our Paleogene features. Eric Cauquil is also acknowledged for sharing with us his experience and image library on this Nigerian analog. Finally, many thanks to Mads Huuse whose constructive comments and friendly encouragements on an earlier version of this paper greatly helped its finalization.
__________________________________________________________________________________________________________________________________________________
References
Aarnes, I., Svensen, H., Connolly, J.A.D., Podladchikov, Y.Y., 2010. How contact meta-
morphism can trigger global climate changes: modeling gas generation around
igneous sills in sedimentary basins. Geochimica et Cosmochimica Acta 74,
7179–7195.
Abegg, F., Bohrmann, G., Kuhs, W., 2006. Data report: shapes and structures of gas
hydrates imaged by computed tomographic analyses, ODP les 204, Hydrate
Ridge. Chapter 21. In: Tréhu, A.M., Bohrmann, G., Torres, M.E., Colwell, F.S. (Eds.),
Proceedings of the Ocean Drilling Program: Scienti fi c Results, vol. 204.
Anderson, E.M., 1936. The dynamics of the formation of cone-sheets, ring-dykes and
cauldron-subsidence. Proceedings of the Royal Society of Edinburgh 56, 128–157.
Bice, K.L., Marotzke, J., 2002. Could changing ocean circulation have destabilized methane
hydrate at the Paleocene/Eocene boundary? Paleoceanography 17 http://dx.doi.org/
10.1029/2001PA000678.
Bourget, J., Zaragosi, S., Ellouz-Zimmermann, N., Mouchot, N., Garlan, T., Schneider, J.-L.,
Lanfumey, V., Lallemant, S., 2011. Turbidite system architecture and sedimentary
processes along topographically complex slopes: the Makran convergent margin.
Sedimentology 58, 376–406.
Brinkhuis, H., Schouten, S., 2006. Episodic fresh surface waters in the Eocene Arctic
Ocean. Nature 441, 606–609.
Bull, S., Cartwright, J., Huuse, M., 2009. A review of kinematic indicators from mass-
transport complexes using 3-D seismic data. Marine and Petroleum Geology 26,
1132–1151.
Cartwright, J.A., 1994. Episodic basin-wide fl uid expulsion from geopressured shale
sequences in the North Sea Basin. Geology 22, 447–450.
Cartwright, J., 2011. Diagenetically induced shear failure of fi ne-grained sediments and
the development of polygonal fault systems. Marine and Petroleum Geology 28,
1593–1610.
Cartwright, J.A., Lonergan, L., 1996. Volumetric contraction during the compaction of
mudrocks: a mechanism for the development of regional-scale polygonal fault sys-
tems. Basin Research 8, 183–193.
Cartwright, J.A., James, D., Huuse, M., Vetel, W., Hurst, A., 2008. The geometry and em-
placement of conical sandstone intrusions. Journal of Structural Geology 30 (7),
854–867.
Darwin, C., 1846. Geological Observations on South America, Being the Third Part of the
Geology of the Voyage of the Beagle, under the Command of Capt. Fitzroy, R.N. dur-
ing the Years 1832 to 1836.
Diller, J.S., 1890. Sandstones dikes. Bulletin of the Geological Society of America 1, 411.
Elliott, T., 2000. Mega fl ute erosion surfaces and the initiation of turbidite channels.
Geology 28, 119–122.
Farre, J.A., Ryan, W.B.F., 1985. 3-D view of erosional scars on U. S. mid-Atlantic
continental margin. American Association of Petroleum Geologists Bulletin 69,
923–932.
George, R.A., Cauquil, E., 2007. AUV ultra high-resolution 3D seismic technique for
detailed subsurface investigations. Offshore Technology Conference, Houston
(2007), Paper # OTC 18784.
Ginsburg, G.D., Soloviev, V.A., 1998. Submarine Gas Hydrates. VNIIOkeangeologia, St
Petersburg.
Goncharov, A., Deighton, I., Duffy, L., McLaren, S., Tischer, M., Heine, C., 2006. Basement
and crustal controls on hydrocarbons maturation on the Exmouth Plateau, North
West Australian Margin. Search and Discovery Article # 10119.
Hansen, D.M., Cartwright, J., 2006. The three-dimensional geometry and growth of
forced folds above saucer-shaped igneous sills. Journal of Structural Geology 28,
1520–1535.
Hovland, M., Judd, A.G., 1988. Seabed Pockmarks and Seepages: Impact on Geology,
Biology and the Marine Environment. Graham and Trotman, London.
Hurst, A., Cartwright, J., 2007. Sand injectites: implications for hydrocarbon exploration
and production. AAPG Memoir 87.
Huuse, M., Mickelson, M., 2004. Eocene sandstone intrusions in the Tampen Spur area
(Norwegian North Sea Quad 34) imaged by 3D seismic data. Marine and Petroleum
Geology 21, 141–155.
Huuse, M., Duranti, D., Steinsland, N., Guargena, C.G., Prat, P., Holm, K., Cartwright, J.A.,
Hurst, A., 2004. Seismic characteristics of large-scale sandstone intrusions in the
Paleogene of the South Viking Graben, UK and Norwegian North Sea. In: Davies,
R.J., Cartwright, J.A., Stewart, S.A., Lappin, M., Underhill, J.R. (Eds.), 3D Seismic
Technology: Application to the Exploration of Sedimentary Basins: Geological
Society, London, Memoirs, vol. 29, pp. 263–277.
Huuse, M., Cartwright, J.A., Gras, R., Hurst, A., 2005. Kilometre-scale sandstone intru-
sions. In: Doré, A.G., Vining, B.A. (Eds.), Petroleum Geology: North-West Europe
and Global Perspectives — Proceedings of the Sixth Petroleum Geology Conference.
Geological Society, London, pp. 1577–1594.
Huuse, M., Cartwright, J., Hurst, A., Steinsland, N., 2007. Seismic characterization of
large-scale sandstone intrusions. In: Hurst, A., Cartwright, J. (Eds.), Sand Injectites:
Implications for Hydrocarbon Exploration and Production: American Association of
Petroleum Geologists Memoir, 87, pp. 21–35.
Huuse, M., Van Rensbergen, P., Jackson, C.A.-L., Flemings, P.B., Davies, R.J., Dixon, R.J.
(Eds.), 2010. Special issue: subsurface sediment remobilization and fl uid fl ow in
sedimentary basins: Basin Research, 22. V4.
Iglesias, J., Ercilla, G., García-Gil, S., Judd, A.G., 2010. Pockforms: an evaluation of
pockmark-like seabed features on the Landes Plateau, Bay of Biscay. Geo-Marine
Letters 30, 207–219.
Jackson, C.A.-L., 2007. The geometry, distribution and development of clastic injections in
slope systems: seismic examples from the Upper Cretaceous Kyrre Formation, Maloy
Slope, Norwegian Margin. In: Hurst, A., Cartwright, J. (Eds.), 3D Seismic Technology: Ap-
plication to the Exploration of Sedimentary Basins: Sand injectites: implications for hy-
drocarbon exploration and production. AAPG Memoir 87, pp. 37–48.
Jackson, M.P.A., Cramez, C., 1989. Seismic recognition of salt welds in salt tectonics
regimes. SEPM Gulf Coast Section Tenth Annual Research Conference Program
and Abstracts, Houston, Texas, pp. 66–71.
Jenssen, A.I., Bergslien, D., Rye-Larsen, M., Lindholm, R.M., 1993. Origin of complex
mound geometry of Paleocene submarine-fan reservoirs, Balder Field, Norway.
In: Parker, J.R. (Ed.), Petroleum Geology of Northwest Europe: Proceedings of the
4th Conference. Geological Society, London, pp. 135–143.
Judd, A.G., Hovland, M., 2007. Seabed Fluid Flow: the Impact on Geology, Biology and
the Marine Environment. Cambridge University Press, Cambridge.
Kennett, J.P., Stott, L.D., 1991. Abrupt deep-sea warming, palaeoceanographic changes
and benthic extinctions at the end of the Palaeocene. Nature 353, 225–229.
Kvenvolden, K.A., 1998. A primer on the geological occurrence of gas hydrates. In:
Henriet, J.P., Mienert, J. (Eds.), Gas Hydrates — Relevance to World Margin Stability
and Climate Change. The Geological Society, London, pp. 9–30.
Labourdette, R., 2007. Integrated three-dimensional modeling approach of stacked
turbidite channels. American Association of Petroleum Geologists Bulletin 91,
1603–1618.
Lee, S.E., Talling, P.J., Ernst, G.G.J., Hogg, A.J., 2002. Occurrence and origin of submarine
plunge pools at the base of the US continental slope. Marine Geology 185, 363–377.
León, R., Somoza, L., Medialdea, T., Hernández-Molina, F.J., Varquez, J.T., Díaz-del-Rio,
V., González, F.J., 2010. Pockmarks, collapses and blind valleys in the Gulf of
Cádiz. Geo-Marine Letters 30, 231–247.
Lonergan, L., Cartwright, J.A., 1999. Polygonal faults and their in fl uence on resevoir
geometries. Alba Field, United Kingdom.
Longley, I.M., Buessenschuett, C., Clydsdale, L., Cubitt, C.J., Davis, R.C., Johnson, M.K.,
Marshall, N.M., Murray, A.P., Somerville, R., Spry, T.B., Thompson, N.B., 2002. The
North West Shelf of Australia — a Woodside perspective, the sedimentary basins
of Western Australia. In: Keep, M., Moss, S. (Eds.), Proceedings of the Western
Australian Basins Symposium v. 3. Petroleum Exploration Society of Australia,
Perth, pp. 28–88.
Loucks, R.G., 1999. Paleocave carbonate reservoirs: origins, burial-depth modi fi cations,
spatial complexity, and reservoir implications. American Association of Petroleum
Geologists Bulletin 83, 1795–1834.
MacLeod, M.K., Hanson, R.A., Bell, C.R., McHugo, S., 1999. The Alba fi eld ocean bottom
cable seismic survey: impact on development. The Leading Edge 83, 1306–1312.
MacQuillin, R., Fannin, N.G.T., 1979. Explaining the North Sea's lunar sea fl oor. New
Scientist (1971) 83, 90–92.
Malone, R., 1985. Gas Hydrates Topical Report–DOE/METC/SP-218 (DE85001986).
DOE, Morgantown Energy Technology Center, Morgantown.
Mazurenko, L.L., Matveeva, T.V., Prasolov, E.M., Shoji, H., Obzhirov, A.I., Jin, Y.K., Poort, J.,
Logvina, E.A., Minami, H., Sakagami, H., Hachikubo, A., Salomatin, A.S., Salyuk, A.M.,
Prilepskiy, E.B., Chaos 2003 Scienti fi c Team, 2009. gas hydrate forming fl uids on the
NE Sakhalin slope, Sea of Okhotsk. In: Long, D., Lovell, M.A., Rees, J.G., Rochelle, C.A.
(Eds.), Sediment-hosted Gas Hydrates: New Insights on Natural and Synthetic
Systems: Geological Society of London, Special Publication, 319, pp. 51–72.
Molyneux, S., Cartwright, J., Lonergan, L., 2002. Conical sandstone injection structures
imaged by 3D seismic in the central North Sea, UK. First Break 20, 383–393.
Mondshine, T.C., Kercheville, J.D., 1966. Successful gumbo-shale drilling. Oil and Gas
Journal 64 (13), 194.
Moscardelli, L., Wood, L., Mann, P., 2006. Mass-transport complexes and associated
processes in the offshore area of Trinidad and Venezuela. AAPG Bulletin 90,
1059–1088.
Mourgues, R., Gressier, J.B., Bodet, L., Bureau, D., Gay, A., 2011. “Basin scale” versus
“localized” pore pressure/stress coupling — implications for trap integrity evalua-
tion. Marine and Petroleum Geology 8, 1111–1121.
Mutti, E., 1992. Turbidite Sandstones. AGIP –Istituto di Geologia Università di Parma,
San Donato Milanese . (275 pp.).
Newsom, J.F., 1903. Clastic dikes. Bulletin of the Geological Society of America 14, 227.
Panchuk, K., Ridgwell, A., Kump, L.R., 2008. Sedimentary response to Paleocene–Eocene
thermal maximum carbon release: a model-data comparison. Geology 36, 315–318.
Pape, T., Bahr, A., Klapp, S.A., Abegg, F., Bohrmann, G., 2011. High-intensity gas seepage
causes rafting of shallow gas hydrates in the southeastern Black Sea. Earth and
Planetary Science Letters 307, 35–46.
Parize, O., Friès, G., 2003. The Vocontian clastic dykes and sills: a geometric model. In:
Van Rensbergen, P., Hillis, R.R., Maltman, A.J., Morley, C.K. (Eds.), Subsurface Sedi-
ment Mobilization: Geological Society, London, Special Publication, 216, pp. 51–71.
Pecher, I.A., Ranero, C.R., von Huene, R., Minshull, T.A., Singh, S.C., 1998. The nature and
distribution of bottom simulating re fl ectors at the Costa Rican convergent margin.
Geophysical Journal International 133, 219–229.
Pecher, I.A., Kukowski, N., Ranero, C.R., von Huene, R., 2001. Gas hydrates along the
Peru and Middle America trench systems. In: Paull, C.K., Dillon, W.P. (Eds.), Natural
Gas Hydrates: Occurrence, Distribution, and Detection. : Geophysical Monograph
Series, 124. American Geophysical Union, Washington, D.C., pp. 257–271.
Rodrigues, N., Cobbold, P.R., Løseth, H., 2009. Physical modelling of sand injectites.
Tectonophysics 474, 610–632.
Séranne, M., Nzé Abeigne, C.-R., 1999. Oligocene to Holocene sediment drifts and bottom
currents on the slope of Gabon continental margin (west Africa). Consequences for sed-
imentation and southeast Atlantic upwelling. Sedimentary Geology 128, 179–199.
Shoulders, S.J., Cartwright, J.A., Huuse, M., 2007. Large-scale conical sandstone intru-
sions and polygonal fault systems in Tranche 6, Faroe–Shetland Basin. Marine
and Petroleum Geology 24, 173–188.
Sluijs, A., 2006. Global change during the Paleocene – Eocene thermal maximum. PhD
dissertation, LPP contribution series No. 21.
Stewart, S.A., 1999. Seismic interpretation of circular geological structures. Petroleum
Geoscience 5, 273–285.
Sultan, N., Marsset, B., Ker, S., Marsset, T., Voisset, M., Vernant, A.-M., Bayon, G., Cauquil,
E., Adamy, J., Colliat, J.-L., Drapeau, D., 2010. Hydrate dissolution as a potential
mechanism for pockmark formation in the Niger delta. Journal of Geophysical
Research 115, B08101 http://dx.doi.org/10.1029/2010JB007453.
Sun, Q., Wu, S., Hovland, M., Luo, P., Lu, Y., Qu, T., 2011. The morphologies and genesis
of mega-pockmarks near the Xisha Uplift, South China Sea. Marine and Petroleum
Geology 28, 1146–1156.
Surlyk, F., 1987. Slope and deep shelf gully sandstones, Upper Jurassic, East Greenland.
AAPG Bulletin 71–4, 464–475.
Svensen, H., Planke, S., Malthe-Sorenssen, A., Jamtveit, B., Myklebust, R., Eidem, T.R.,
Rey, S.S., 2004. Release of methane from a volcanic basin as a mechanism for initial
Eocene global warming. Nature 429, 542–545.
Svensen, H., Planke, S., Corfu, F., 2010. Zircon dating ties NE Atlantic sill emplacement
to initial Eocene global warming. Journal of the Geological Society of London 167,
433–436.
Thomas, E., Shackleton, N.J., 1996. The Palaeocene–Eocene benthic foraminiferal
extinction and stable isotope anomalies. In: Knox, R.W.O.B., Cor fi eld, R.M., Dunay,V. (Eds.), Correlation of the Early Paleogene in Northwestern Europe: Geological
Society of London Special Publication, 101, pp. 401–441.
Tripati, A., Elder fi eld, H., 2005. Deep-sea temperature and circulation changes at the
Paleocene–Eocene thermal maximum. Science 308, 1894–1898.
Vail, P.R., Todd, R.G., Sangree, J.B., 1997. Seismic stratigraphy and global changes of sea
level: part 5. Chronostratigraphic signi fi cance of seismic re fl ections: section 2.
Application of seismic re fl ection con fi guration to stratigraphic interpretation.
Seismic Stratigraphy—Applications to Hydrocarbon Exploration: AAPG Memoir,
26, pp. 99–116.
Van Rensbergen, P., Hillis, R.R., Maltman, A.J., Morley, C.K. (Eds.), 2003. Subsurface sed-
iment mobilization. Special Publication nr, Geological Society, London, Geological
Society, London. 216.
Vigorito, M., Hurst, A., Cartwright, J., Scott, A., 2008. Regional-scale subsurface crustal
sediment remobilization: geometry and architecture. Journal of the Geological
Society of London, Special Publication 165, 609–612.
Weimer, P., 1991. Seismic facies, characteristics and variations in channel evolution,
Mississippi Fan (Plio-Pleistocene), Gulf of Mexico. In: Weimer, P., Link, M.H.
(Eds.), Seismic Facies and Sedimentary Processes of Submarine Fans and Turbidite
Systems. Springer-Verlag, New York, pp. 323–347.
Young, H.C., 2001. The sequence Stratigraphic Evolution of the Exmouth-Barrow
Margin, Western Australia. PhD dissertation, University of Adelaide.
Zachos, J.C., Wara, M.W., Bohaty, S., Delaney, M.L., Petrizzo, M.R., Brill, A., Bralower, T.J.,
Premoli Silva, I., 2003. A transient rise in tropical sea surface temperature during
the Paleocene–Eocene thermal maximum. Science 302, 1151–1154.
Key words: Sutieng Ho pockmark Sutieng Ho gas chimney seismic Sutieng Ho polygonal fault Sutieng Ho methane authigenic carbonate Sutieng Ho Lower Congo Basin Angola

Fluid-Venting-System website by S. HO is licensed under a Creative Commons Attribution-NonCommercial-NoDerivatives 4.0 International License.

